Abstract
Recently developed techniques have enabled volume loss measurements on surgically retrieved total knee replacements (TKR). However, it is not well understood how volume loss relates to polyethylene surface damage appearance. Sixty-four fixed bearing cruciate retaining components retrieved from revision and postmortem surgeries were analyzed for penetration and volume loss on the topside articular surface. An autonomous reconstruction method was used to approximate the original unworn surfaces. Surface damage patterns were also mapped using a video microscope, and each pattern’s contribution to volume loss was calculated. With consideration for creep, a total wear rate of 12.9 ± 5.97 mm3/year was found for the population. The penetration rate was 0.035 ± 0.017 mm/year medially and 0.034 ± 0.011 mm/year laterally, of which the location on the plateau varied greatly. Although striated patterns contributed to most to volume loss, damage patterns generally were only moderate predictors of material volume loss.
Keywords: polyethylene (UHMWPE), wear, knee replacement, retrieval analysis, volume reconstruction
INTRODUCTION
Wear of the ultra-high molecular weight polyethylene (UHWMPE) component and the subsequent aseptic loosening remains a primary reason for late revision of total knee replacements (TKRs).(1) Recent improvements in material, design and manufacturing aimed at reducing wear have yielded positive results in laboratory testing on mechanical wear simulators. However, studies have noted significant discrepancies between simulator-tested components and tibial inserts retrieved from patients regarding location, magnitude, visual appearance and variability of wear.(2), (3) As designs and testing continue to evolve more rapidly than the lifespan of most implants, the discrepancies between lab and life underscore the importance of retrospective retrieval studies to evaluate the in vivo wear properties of TKRs.
Retrieval studies of TKRs have traditionally relied on the scoring of surface damage patterns as a semiquantitative surrogate for the magnitude of wear.(4), (5) These observations are often interpreted in relation to wear mechanisms and causes of failure, yet it is unclear how these damage patterns relate to the volume of polyethylene lost in vivo. Some studies use thickness changes of the polyethylene liner to quantify the linear penetration of the femoral component,(2), (6), (7) analogous to techniques used at the hip. However, this single point measurement does not provide a complete picture of wear due to the complex geometries of the tibial articular surfaces. Three dimensional acquisition techniques, such as those afforded by microcomputed tomography (micro-CT)(8) and coordinate measuring machines (CMM)(9), have enabled researchers to obtain high resolution scans of retrieved tibial inserts. Because the original surface before implantation is not available, a substitute reference geometry is used to estimate the unworn surface. In literature, such surfaces have been derived from computer-aided design (CAD) models(10), unused matching inserts (11)–(15) and mathematical reconstructions based on unworn areas of the retrieved component.(14), (16)–(18) However, design surfaces are proprietary, and obtaining new components of retrieved designs may be difficult, impractical and expensive.(19) Furthermore, neither can account for the manufacturing variability of the parts, with reported tolerances of ±0.13mm(20), ±0.25mm(12), (21) and ±0.35mm(2) and measured surface variations on unused parts from 0.05mm(7) up to 0.152mm(20) and 0.21mm(22). Mathematical reconstruction is a high resolution method of investigating the magnitude and spatial distribution of volume changes on the articular surface of TKR tibial inserts, which can adapt to manufacturing tolerances and surface variations.(18)
While improved measurement techniques have provided more quantitative information on the wear of surgically retrieved inserts, it remains unknown if material loss can be predicted from observed damage patterns, or if the various damage patterns translate to different amounts of polyethylene wear in vivo. This study (a) examines the wear rate of a cruciate retaining TKR design and (b) relates observed wear patterns to volume loss on the surface. The overall purpose of this study is to investigate the relationship of damage patterns and volume loss at the articular surface of total knee replacements. As damage patterns have historically been the measure of choice for TKR retrieval analysis, we hypothesize that damage patterns are reliable predictors of volume loss.
MATERIALS AND METHODS
Institutional Review Board approval was obtained from Rush University Medical Center. 43 revision-retrieved and 21 postmortem-retrieved cruciate-retaining (CR) MG II ultra-high molecular weight polyethylene (UHMWPE) tibial inserts (Zimmer Inc., Warsaw, IN, USA) were available through the implant retrieval repository at the commencement of this study. Components were fabricated using GUR 415 PE resin with 0.05% calcium stearate additive and sterilized by gamma radiation in air. The 64 components (35 Left / 29 Right) included three sizes (15 small / 28 medium / 21 large) and were obtained from 58 different patients (33 F / 25 M). Reasons for revision surgery were listed as infection (9), aseptic loosening / osteolysis (9), patellar subluxation/dislocation (6), periprosthetic fracture (4), failed tibial component (3) stiffness (2), instability (2), pain (2) and pain and instability (2). The reason for revision was not available for the remaining components (4). Implantation times for revision-retrieved components averaged 3.0 ± 2.6 years in situ (range: 0.03–9.0 years, 5 unknown), with patient age at time of implantation averaging 61.1 ± 10.8 years old (range: 38.7–80.6 years old, 10 unknown). Implantation times for postmortem-retrieved components were significantly longer, averaging 6.6 ± 2.8 years in situ (range: 1.6–12.1 years). Patient age at time of implantation average 75.2 ± 8.6 years old (range: 59.3–87.4 years old) for postmortem-retrieved components. Although components with unknown in situ time could not be used to analyze wear rate, they could be included in pattern analysis.
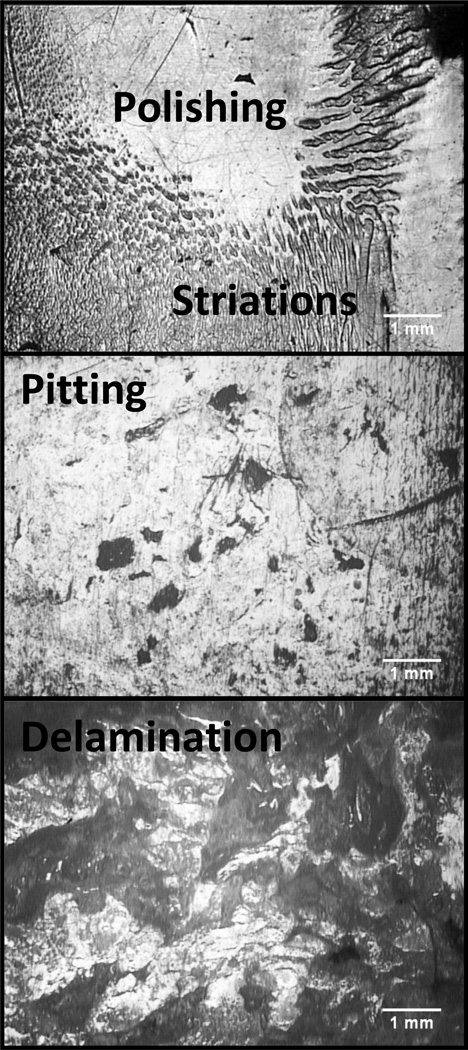
Two different investigators independently recorded damage patterns and volume loss on tibial polyethylene liners. The areas of visual damage patterns on the articular surfaces were examined and outlined with a video microscope (SmartScope; OGP Inc., Rochester, NY, USA).(23) Four categories of patterns, seen in Figure 1, were measured: 1) delamination – areas of subsurface cracking and/or loss from large material fragments, 2) pitting – areas of small, crater-like, irregularly shaped depressions, 3) striations – short and elongated striped surfaces regions(24) and 4) polishing – highly reflective regions on the tibial plateau.
Figure 1.
Representative microscopy images of the observed wear patterns polishing, striations, pitting and delamination on the articular surfaces of the retrieved components viewed at 33.3x magnitude.
Articular surfaces were digitized at 100x100 µm2 nominal XY point spacing with a low-incidence laser CMM (SmartScope; OGP Inc., Rochester, NY, USA) resulting in scans with more than 400,000 data points at nominal depth accuracy of ±2µm. Using a previously described and validated method, termed “autonomous reconstruction” (18), a design-congruent parametric surface was manually registered to unworn surface regions with custom MATLAB software (MathWorks, Inc., Natick, MA, USA) guided by visual assessment of the part. This was accomplished by rotating and translating the measured point cloud, such that areas where machining marks were still visible on the retrieved component corresponded with little to no deviation between the virtual reference surface and the measure points. Parameters defining the surface, such as curvatures and thickness, were then optimized using a least-squares minimization to measured points within ±50µm of the virtual surface to create a best-fit reference geometry. By calculating the volume difference between the reference and measured surfaces, the spatial distribution of volume loss was determined and mapped. The medial and lateral sides of each insert were analyzed separately, and maximum penetration was calculated for each side.
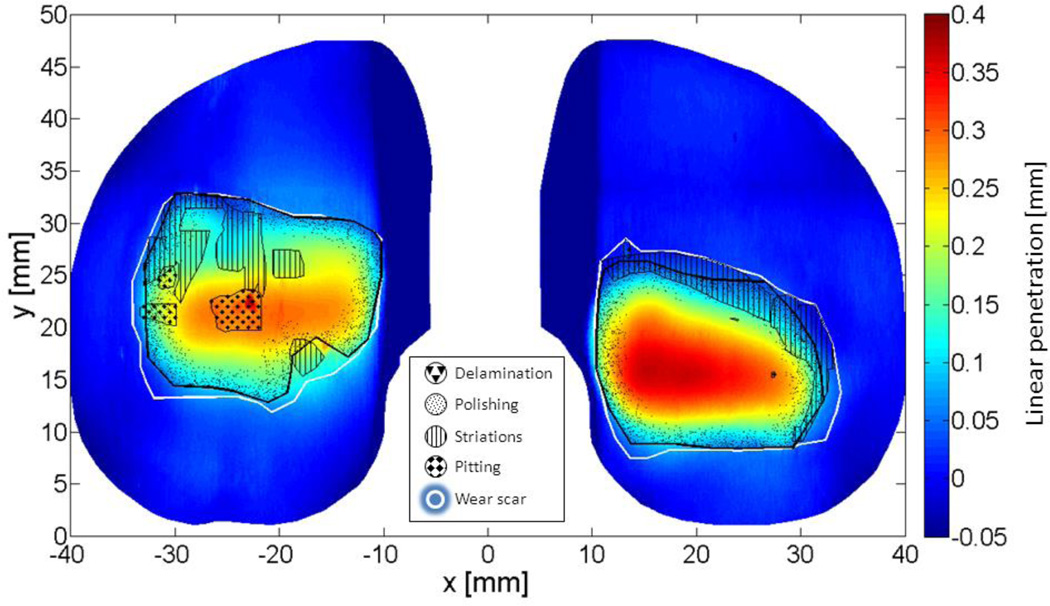
For each insert, damage pattern outlines were overlaid on the spatialized volume loss, as exemplified in Figure 2. As seen here, two or more patterns can be observed to overlap in the same area. For the purpose of calculating a pattern’s contribution to total volume loss, pattern areas were made spatially exclusive according to the following priority: 1) delamination, 2) pitting, 3) striations and 4) polishing. In this analysis, if a region exhibited both polishing and pitting, it was associated with pitting. Similarly, if a region exhibited striations and polishing, it was associated with striations. Volume loss associated with each damage pattern was determined by calculating the volume loss contained within each pattern’s outline. This pattern-specific volume loss was expressed as a percentage of the total volume loss on a part. When a pattern was not present, associated volume loss did not exist and was therefore not included in calculations.
Figure 2.
Volume loss map created by autonomous reconstruction of the topside articular surface of a retrieved tibial liner overlaid with outlines of observed damage patterns and total wear scars.
Wear rates for the entire population were calculated by linear regression with unconstrained intercepts. Volume loss due to creep was estimated for the population using the intercept of each linear wear rate regression, which represents a theoretical volume loss at time zero. 95% confidence intervals (CIs) were calculated for wear rates and creep estimates. Student t-tests were used to calculate significance between groups.
To investigate the predictability of volume loss using observed patterns, stepwise linear regression models were rendered in PASW Statistics 18 (SPSS Inc., Chicago, IL) using volume loss as the dependent variable and pattern areas as independent variables, with an entry probability of 0.05 and a removal probability of 0.10.
RESULTS
Among the articular surfaces of revision- and postmortem-retrieved tibial components, the most frequently observed damage pattern was striations, as seen in Table 1.
Table 1.
Prevalence and areas of observed damaged patterns on revision- and postmortem-retrieved components
| Damage pattern | Total mean area ± SD [mm2] | Prevalence [%] | |
|---|---|---|---|
| Revision | Polishing | 201±146 | 71% |
| Striations | 254±161 | 83% | |
| Pitting | 212±520 | 76% | |
| Delamination | 379±440 | 29% | |
| Wear scars | 932±475 | - | |
| Postmortem | Polishing | 198±134 | 90% |
| Striations | 361±180 | 100% | |
| Pitting | 15.9±17.2 | 81% | |
| Delamination | 595±389 | 29% | |
| Wear scars | 1004±320 | - | |
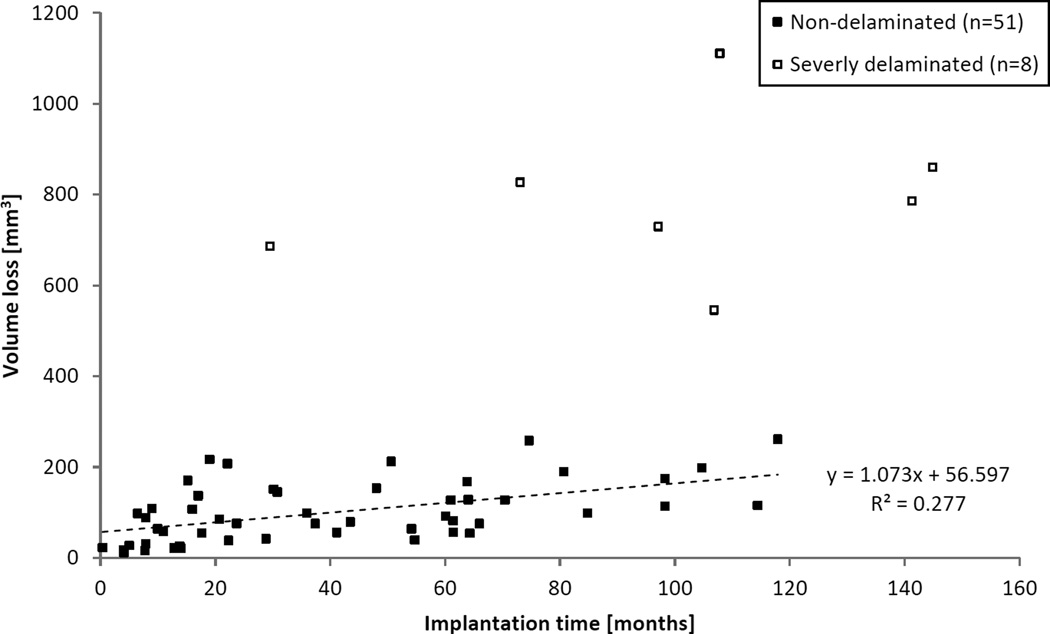
All components that experienced total volume loss higher than 300 mm3 were characterized by an extremely jagged topography and appearance, where large flakes of material had detached from the surface due to delamination. With these eight components excluded (in addition to five components with unknown in situ time), the population’s total wear rate (±95% CI) was 12.9 ± 5.97 mm3/year (Pearson’s r = 0.527, p < 0.001), as seen in Figure 3. Volume loss due to creep was 56.6 ± 25.8 mm3, estimated by the time zero intercept of the linear wear rate. Although 22 revision and 1 postmortem components were retrieved before 2 years of implantation, the wear rate of non-delaminated components removed after 2 years in vivo was 13.6 ± 10.64 mm3/year (Pearson’s r = 0.457, p = 0.016), which was not significantly different from the wear rate for the entire non-delaminated group (p = 0.906). The wear rate on the medial side was 6.56 ± 3.91 mm3/year (Pearson’s r = 0.434, p = 0.002), and on the lateral side it was 6.32 ± 3.44 mm3/year (Pearson’s r = 0.467, p < 0.001). These rates were not significantly different (p = 0.926).
Figure 3.
Total volume loss as a function of implantation time for combined revision- and postmortem-retrieved components. Eight severely delaminated parts (□) have been excluded from wear rate calculations, as well as five components where implantation time was not available.
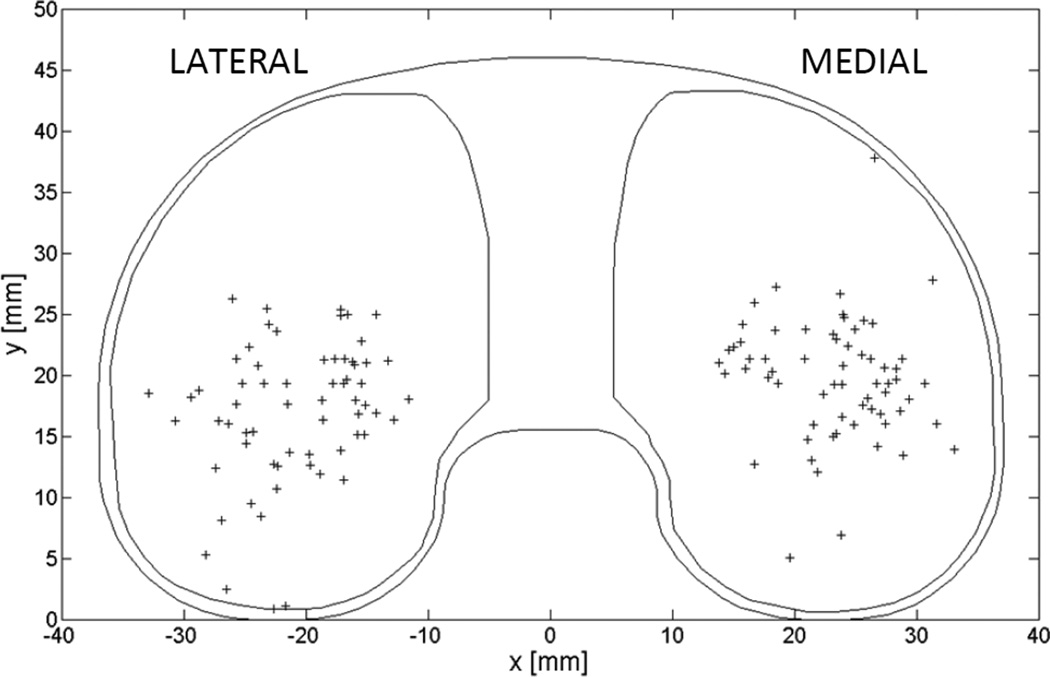
The penetration wear rate (±95% CI) was 0.035 ± 0.017 mm/year medially (Pearson’s r = 0.520, p < 0.001) and 0.034 ± 0.011 mm/year laterally (Pearson’s r = 0.681, p < 0.001) as measured by autonomous reconstruction at the point of maximum penetration with allowance for penetration due to creep in the population. Figure 4 shows the locations of maximum penetration on each tibial plateau normalized to a medium-sized, left side insert. These locations varied greatly and rarely coincided with the center of the plateau or the location of minimum thickness on the components.
Figure 4.
Locations of maximum penetration (+) on all parts, normalized to a left-sided medium-sized tibial liner.
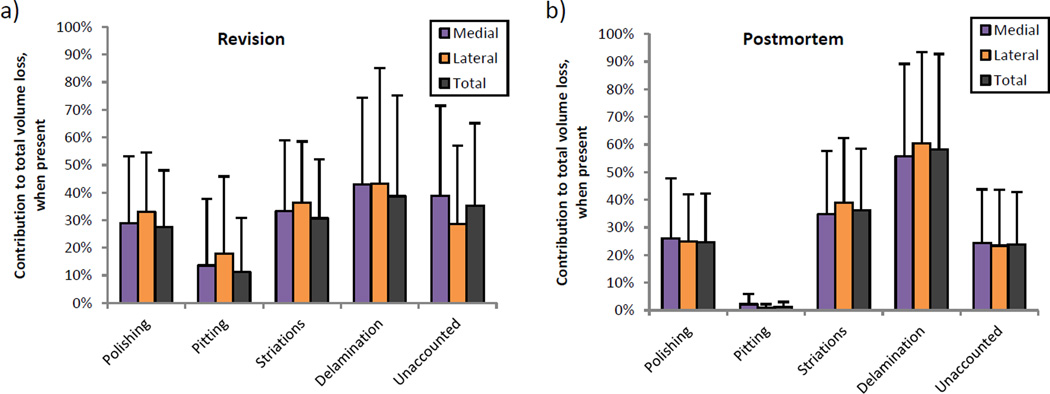
Figure 5 expresses volume loss associated with damage patterns as percentages of total volume loss on the part. When delamination was present, it contributed most to volume loss in revision and postmortem groups, followed by striations and then by polishing. However, there were no statistically significant differences among these patterns’ contributions. Between revision and postmortem groups, pitting contributed significantly more to volume loss in revision-retrieved components (11.3% ± 19.6%) than in postmortem-retrieved components (1.3% ± 1.7%, p = 0.010), despite a slightly lower occurrence of pitting on revision components (76%) than on postmortem components (81%).
Figure 5.
Volume loss contained within each wear pattern, expressed as a percentage of the total wear on that part. Revision components (a) and postmortem components (b) only differed in that areas of pitting accounted for significantly more volume loss on revised components.
Linear regression models of volumes loss that included delaminated components (n=64) revealed that delaminated and striated areas were significant predictors of volume loss on the medial side, lateral side and total part (Table 2). Pitted area was also a significant factor on the total part, but fell out of the medial and lateral models. When delaminated components were excluded (n=56), volume loss was similarly explained by striated and pitted areas on the medial side and total part. However, the adjusted R2 of these models was low: 0.177 and 0.166, respectively. No pattern area was significant to explaining volume loss on the lateral side.
Table 2.
Coefficients and significance values of linear regression models using pattern areas to predict volume loss.
| Side | Adjusted R2 | Damage pattern | Coefficient | Significance | |
|---|---|---|---|---|---|
| All components |
Total | 0.780 | Striations | 0.279 | 0.001 |
| Pitting | 0.103 | 0.004 | |||
| Delamination | 0.535 | 0.000 | |||
| Medial | 0.676 | Striations | 0.281 | 0.007 | |
| Pitting | - | - | |||
| Delamination | 0.562 | 0.000 | |||
| Lateral | 0.756 | Striations | 0.144 | 0.043 | |
| Pitting | - | - | |||
| Delamination | 0.513 | 0.000 | |||
| Non- delaminated components |
Total | 0.177 | Striations | 0.158 | 0.002 |
| Pitting | 0.054 | 0.017 | |||
| Medial | 0.166 | Striations | 0.161 | 0.002 | |
| Pitting | 0.057 | 0.015 | |||
| Lateral | - | Striations | - | - | |
| Pitting | - | - | |||
Blanks indicate that the damage pattern was excluded from the stepwise linear regression model due to lack of significance (p > 0.1). Polishing was not included in this table, as it was not a significant factor in any model.
DISCUSSION
This study is the first to calculate volumetric wear in conjunction with spatialized visual damage appearance on clinically retrieved TKRs. Since weight loss cannot be measured on retrieved components, this study uses volume loss as a proxy of wear. However, volume loss may not be equivalent to material loss due to creep of the polyethylene under the continual loading at the knee. Using only geometric methods, it is impossible to separate creep and wear volumes on an individual retrieved component. Therefore, this study calculates a linear wear rate for the population and uses the intercept at implantation time = 0 as an estimate of volume loss due to creep for the population. Individual wear rates can then be adjusted by the population creep. Other retrieval studies measuring volumetric wear on the articular surface have calculated wear rates ranging from 17.3 to 749 mm3/year.(11), (13), (14), (16), (25), (26) Many of these studies are limited by low measurement resolution, accuracy of reference surface or inclusion of severely delaminated components. Notably, the wear rate closest to our finding was also calculated as the slope of the linear regression for the entire population with consideration for volume lost to creep,(14) whereas the others were derived as a mean rate of wear volumes normalized to time in situ – measurements that inherently include plastic deformation. Since creep is a non-linear time-dependent phenomenon that occurs at a much higher rate directly after surgery, wear rates calculated by normalizing to time in situ will bias results towards higher wear rates, particularly if the number of short-term components is high.
The current study is in good agreement with wear simulator studies of similar TKR designs. Schwenke et al. tested two groups of cruciate-retaining MGII components with ISO displacement- and load-controlled level walking and found steady state wear rates of 9.2±0.9mg/Mc and 20.9±4.2mg per million cycles respectively.(27) CMM measurements of a similar fixed bearing cruciate retaining design run for 5 million cycles of ISO load-controlled level walking found a wear rate of 8.3 ± 0.9 mm3/million cycles and a creep volume loss of 36 ± 4 mm3.(9) Additionally, these researchers found that creep had reached steady state before 1 million cycles. Another metrological study using micro-CT ran an ISO displacement-controlled level walking profile with modified secondary motions from healthy patient kinematics on a comparable design and found a steady-state wear rate of 17 mm3/million cycles from 3.2 to 6.1 million cycles.(28) No creep was observed in this portion of the test. The current study found a comparable wear rate and comparable volume loss due to creep. The rate of penetration fell in the low range for retrieved fixed bearing cruciate retaining designs, which have been reported in literature as 0.054 mm/year medially and 0.029 mm/year laterally,(21) 0.07 mm/year,(20) 0.13 mm/year(13) and 0.35 mm/year.(11) However, these retrieval studies often measure net changes in liner thickness with dial gauges or calipers at a single point, generally the minimum thickness of the plateau. This study shows that the location of maximum penetration did not always coincide with the minimum thickness of the part, found at the center of the tibial plateau. As with volumetric wear rate measurements, reference geometry choices and penetration due to creep may further confound the findings of these earlier studies.
Interestingly, the volumetric and penetration wear rates were nearly identical between medial and lateral sides of the studied inserts. Further paired Student t-tests show no significant difference between medial and lateral volume loss (p=0.54) or linear penetration (p=0.42) for all components (n=64). Unlike the measured load distribution from instrumented TKR studies, (29)(30) our wear data is not systematically higher in the medial compartment than in the lateral compartment for this design. Other factors like sliding distance, cross-shear, and implant alignment may account for the equal wear rates between compartments.
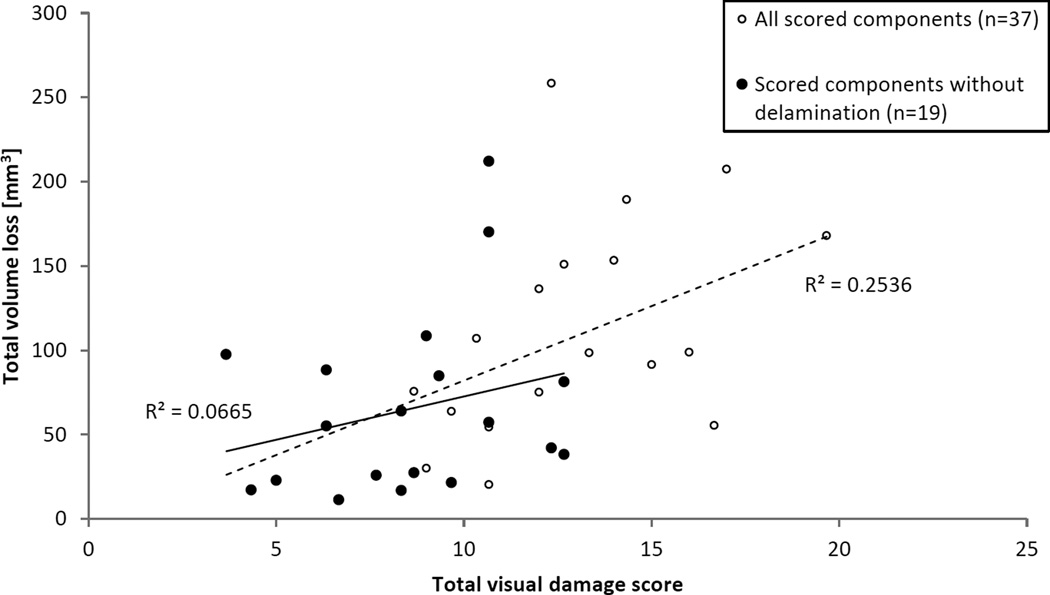
The method established by Hood et al.(4) was the first to report a classification and quantification scheme for damage appearance on retrieved TKR liners. It has served as the guideline to quantify total knee wear for numerous papers to follow, as evidenced by more than 250 citations.(31) The appearance of damage includes important clues for the identification of the acting wear mechanism; however, as suggested by our study, damage patterns are only moderate predictors for material loss with the expected exception of delamination. Because the large flake-like material loss from subsurface delamination eradicates other surface patterns, a non-delaminated subset was analyzed to better address modern TKRs. The large reduction in adjusted R2 of the linear regression model indicates that delaminated areas were essential to explaining variations in the volume loss. In both cases, polishing was not a significant predictor of material loss. This is surprising, since polishing is the expected surface change of wearing polyethylene, and one would have expected a correlation in well-functioning polyethylene liners. It is possible that well-functioning TKRs may produce well defined polished areas, such that the variation in volume loss is explained more by time in situ – an independent factor not observable during retrieval analysis – than by polished area. A previously published study analyzed retrievals using a visual damage scoring system based on Hood et al. for a population of MGII retrievals that overlapped with the group in the current study.(5) This scoring system visually assessed the articular surface of retrievals for polishing, pitting, delamination and edge deformation, deriving a score for each pattern as a product of extent and severity and total score as a sum of all pattern scores. A retroactive comparison of the total visual damage scores to the total volume losses for all overlapping samples (n=37) in Figure 6 show a significant correlation (Pearson’s r=0.504, p=0.002), not unlike the strong correlation seen in linear regression models including delamination. However, the subset of components without delamination or edge deformation (n=19) exhibits no meaningful correlation between score and volume loss (Pearson’s r=0.258, p=0.212). This further supports the findings of the current study that damage patterns are only moderate predictors of material loss.
Figure 6.
Retroactive comparison of total volume loss, as measured by the current study, to total visual damage score, as measured by a previously published study, for an overlapping set of retrieved components.
Apart from delamination, striated damage patterns accounted for the highest contribution to volume loss and were moderate predictors of wear. Striated patterns are rarely reported in simulator testing of total knee replacements, although retrieval studies have indicated that striated damage patterns are commonly the most frequent and largest damage modes.(24), (32) A simulator study was able to reproduce longitudinal and transverse striated patterns on components by applying sliding and rolling movement,(33) and considered these patterns representative of a normal wear process specific to the kinematics found at the knee. Although an earlier retrieval paper attributed striations to compressive and tractive forces occurring during femoral rollback,(24) little has come to light since concerning the mechanism by which striations are generated. Our study further evidences the importance of understanding polyethylene striations. To a lesser degree, pitting area was also a significant predictor of volume loss on the total part in linear regression models. Pitting contributed more to volume loss on revision components than it did on postmortem components, possibly driven by the larger mean area of pitting found on revision components. The higher contribution of pitting to total wear volume in revision-retrieved TKR suggests that the fatigue wear mechanism leading to pitting contributes to the need for the early revision of the implant.
It should be noted that this study did not examine all observable polyethylene damage patterns. While scratching and embedded debris were observed in the retrieval group, they were found with such low frequency that these damage modes could not effectively be analyzed as factors contributing to volume loss given the population sample size. Another clear limitation of our study is that we investigated a single design of TKR with low conformity; therefore, our findings cannot be generalized to TKRs at-large. While MGII liners are no longer implanted, the clinical and in vitro results of this design have been well researched. Another limitation is that nearly half of the non-delaminated components spent less than 2 years in situ, with all except one of those retrieved from revision surgery. Eleven of those components experienced less than a year in the body. Confounding factors may affect the rate of volume loss during the first year after surgery, including a running-in phase of wear, recovery from surgery and patient physical therapy. Additionally, epidemiological studies have also documented that reasons for revision differ significantly between early and late revisions.(34), (35) These differences may indicate accelerated or decelerated wear in the different revision populations. However, the current study found that excluding components removed before 2 years in vivo did not significantly change the observed wear rate. While this study characterizes basic demographics of the retrieved population, an investigation of patient factors is beyond the scope of this study. Finally, this study did not investigate backside wear and confined its analysis to damage appearances on the superior articulating surface.
The aim of this study was to better understand the relationship of qualitative damage appearance to wear-related material loss. Damage patterns have long been interpreted as surrogate measures for wear on retrieved TKR polyethylene tibial liners. However, the results of this study indicate that only a few such patterns are moderate predictors of volume loss, and that geometric volume loss provides more accurate quantification of in vivo wear. Although patterns may not accurately quantify the volume of wear, a process that is important to the materials engineering understanding of TKRs, qualitative visual assessment is still a valuable tool that provides both surgeons and engineers insight to in vivo mechanics and potential causes of failure, such as limb alignment, component positioning, fixation, soft tissue response and infection. It is hoped that the quantification of volume loss on the part will supplement current methods of TKR investigation. As this study focuses on the relationship of damage appearance to volume loss, the findings of this study have implications for other joints beyond the knee, such as the ankle or the shoulder, where articulating orthopedic polyethylene finds itself in a similar tribological system.
Acknowledgments
This study was funded in part by NIH Grant R01 AR059843 and the Rush Arthritis and Orthopedics Institute.
REFERENCES
- 1.Gallo J, Goodman SB, Konttinen YT, Wimmer MA, Holinka M. Osteolysis around total knee arthroplasty: A review of pathogenetic mechanisms. Acta Biomater. 2013;9(9):8046–8058. doi: 10.1016/j.actbio.2013.05.005. [DOI] [PMC free article] [PubMed] [Google Scholar]
- 2.Harman MK, Desjardins J, Benson L, Banks SA, Laberge M, Hodge WA. Comparison of polyethylene tibial insert damage from in vivo Function and in vitro wear simulation. J Orthop Res. 2009;27(4):540–548. doi: 10.1002/jor.20743. [DOI] [PubMed] [Google Scholar]
- 3.Orozco DA, Wimmer MA. Pictorial information of TKA wear scars provides information beyond the intrinsic geometrical factors. J Biomech. 2006;39(Suppl 1):S120. [Google Scholar]
- 4.Hood R, Wright T, Burstein A. Retrieval analysis of total knee prostheses: a method and its application to 48 total condylar prostheses. J Biomed Mater Res. 1983;17(5):829–842. doi: 10.1002/jbm.820170510. [DOI] [PubMed] [Google Scholar]
- 5.Wimmer MA, Laurent MP, Haman JD, Jacobs JJ, Galante JO. Surface damage versus tibial polyethylene insert conformity: A retrieval study. Clin Orthop Relat Res. 2012;470(7):1814–1825. doi: 10.1007/s11999-012-2274-y. [DOI] [PMC free article] [PubMed] [Google Scholar]
- 6.Crowninshield RD, Wimmer MA, Jacobs JJ, Rosenberg AG. Clinical performance of contemporary tibial polyethylene components. J Arthroplasty. 2006;21(5):754–761. doi: 10.1016/j.arth.2005.10.012. [DOI] [PubMed] [Google Scholar]
- 7.Kendrick BJL, Longino D, Pandit H, Svard U, Gill HS, Dodd CAF, Murray DW, Price AJ. Polyethylene wear in Oxford unicompartmental knee replacement: a retrieval study of 47 bearings. J Bone Joint Surg Br. 2010;92(3):367–373. doi: 10.1302/0301-620X.92B3.22491. [DOI] [PubMed] [Google Scholar]
- 8.Teeter MG, Naudie DDR, McErlain DD, Brandt JM, Yuan X, MacDonald SJ, Holdsworth DW. In vitro quantification of wear in tibial inserts using microcomputed tomography. Clin Orthop Relat Res. 2011;469(1):107–112. doi: 10.1007/s11999-010-1490-6. [DOI] [PMC free article] [PubMed] [Google Scholar]
- 9.Muratoglu OK, Perinchief RS, Bragdon CR, O’Connor DO, Konrad R, Harris WH. Metrology to quantify wear and creep of polyethylene tibial knee inserts. Clin Orthop Relat Res. 2003;410:155–164. doi: 10.1097/01.blo.0000063604.67412.04. [DOI] [PubMed] [Google Scholar]
- 10.Gill HS, Waite JC, Short A, Kellett CF, Price AJ, Murray DW. In vivo measurement of volumetric wear of a total knee replacement. Knee. 2006;13(4):312–317. doi: 10.1016/j.knee.2006.04.001. [DOI] [PubMed] [Google Scholar]
- 11.Benjamin J, Szivek J, Dersam G, Persselin S, Johnson R. Linear and volumetric wear of tibial inserts in posterior cruciate-retaining knee arthroplasties. Clin Orthop Relat Res. 2001;392:131–138. doi: 10.1097/00003086-200111000-00016. [DOI] [PubMed] [Google Scholar]
- 12.Conditt MA, Thompson MT, Usrey MM, Ismaily SK, Noble PC. Backside wear of polyethylene tibial inserts: mechanism and magnitude of material loss. J Bone Joint Surg Am. 2005;87(2):326–331. doi: 10.2106/JBJS.C.01308. [DOI] [PubMed] [Google Scholar]
- 13.Lavernia CJ, Sierra RJ, Hungerford DS, Krackow K. Activity level and wear in total knee arthroplasty: a study of autopsy retrieved specimens. J Arthroplasty. 2001;16(4):446–453. doi: 10.1054/arth.2001.23509. [DOI] [PubMed] [Google Scholar]
- 14.Ashraf T, Newman JH, Desai VV, Beard D, Nevelos JE. Polyethylene wear in a non-congruous unicompartmental knee replacement: A retrieval analysis. Knee. 2004;11(3):177–181. doi: 10.1016/j.knee.2004.03.004. [DOI] [PubMed] [Google Scholar]
- 15.Teeter MG, Naudie DDR, Milner JS, Holdsworth DW. Determination of reference geometry for polyethylene tibial insert wear analysis. J Arthroplasty. 2011;26(3):497–503. doi: 10.1016/j.arth.2010.01.096. [DOI] [PubMed] [Google Scholar]
- 16.Kop AM, Swarts E. Quantification of polyethylene degradation in mobile bearing knees: a retrieval analysis of the Anterior-Posterior-Glide (APG) and Rotating Platform (RP) Low Contact Stress (LCS) knee. Acta Orthop. 2007;78(3):364–370. doi: 10.1080/17453670710013942. [DOI] [PubMed] [Google Scholar]
- 17.Blunt LA, Bills PJ, Jiang X-Q, Chakrabarty G. Improvement in the assessment of wear of total knee replacements using coordinate-measuring machine techniques. Proc Inst Mech Eng H. 2008;222(3):309–318. doi: 10.1243/09544119JEIM289. [DOI] [PubMed] [Google Scholar]
- 18.Knowlton CB, Wimmer MA. An autonomous mathematical reconstruction to effectively measure volume loss on retrieved polyethylene tibial inserts. J Biomed Mater Res - Part B Appl Biomater. 2013;101B(3):449–457. doi: 10.1002/jbm.b.32782. [DOI] [PMC free article] [PubMed] [Google Scholar]
- 19.Teeter MG, Milner JS, Naudie DDR, MacDonald SJ. Surface extraction can provide a reference for micro-CT analysis of retrieved total knee implants. Knee. 2014;21(4):801–805. doi: 10.1016/j.knee.2014.04.009. [DOI] [PubMed] [Google Scholar]
- 20.Berry DJ, Currier JH, Mayor MB, Collier JP. Knee wear measured in retrievals: A polished tray reduces insert wear. Clin Orthop Relat Res. 2012;470(7):1860–1868. doi: 10.1007/s11999-012-2248-0. [DOI] [PMC free article] [PubMed] [Google Scholar]
- 21.Engh GA, Zimmerman RL, Parks NL, Engh CA. Analysis of wear in retrieved mobile and fixed bearing knee inserts. J Arthroplasty. 2009;24(6):28–32. doi: 10.1016/j.arth.2009.03.010. [DOI] [PubMed] [Google Scholar]
- 22.Teeter MG, Milner JS, MacDonald SJ, Naudie DDR. Manufacturing lot affects polyethylene tibial insert volume, thickness, and surface geometry. Proc Inst Mech Eng H. 2013;227(8):884–889. doi: 10.1177/0954411913486755. [DOI] [PubMed] [Google Scholar]
- 23.Wimmer MA, Paul P, Haman J, Schwenke T, Rosenberg AG, Jacobs JJ. Differences in damage between revision and postmortem retrieved TKA implants. Trans 51st Annu Mtg Orthop Res Soc; 2005. poster #1204. [Google Scholar]
- 24.Wimmer MA, Andriacchi TP, Natarajan RN, Loos J, Karlhuber M, Petermann J, Schneider E, Rosenberg AG. A striated pattern of wear in ultrahigh-molecular-weight polyethylene components of Miller-Galante total knee arthroplasty. J Arthroplasty. 1998;13(1):8–16. doi: 10.1016/s0883-5403(98)90069-9. [DOI] [PubMed] [Google Scholar]
- 25.Engh CA, Zimmerman RL, Hopper RH, Engh GA. Can microcomputed tomography measure retrieved polyethylene wear? Comparing fixed-bearing and rotating-platform knees knee. Clin Orthop Relat Res. 2013;471(1):86–93. doi: 10.1007/s11999-012-2513-2. [DOI] [PMC free article] [PubMed] [Google Scholar]
- 26.Atwood SA, Currier JH, Mayor MB, Collier JP, Van Citters DW, Kennedy FE. Clinical wear measurement on low contact stress rotating platform knee bearings. J Arthroplasty. 2008;23(3):431–440. doi: 10.1016/j.arth.2007.06.005. [DOI] [PubMed] [Google Scholar]
- 27.Schwenke T, Orozco D, Schneider E, Wimmer MA. Differences in wear between load and displacement control tested total knee replacements. Wear. 2009;267:757–762. [Google Scholar]
- 28.Teeter MG, Parikh A, Taylor M, Sprague J, Naudie DD. Wear and creep behavior of total knee implants undergoing wear testing. J Arthroplasty. 2015;30(1):130–134. doi: 10.1016/j.arth.2014.08.001. [DOI] [PubMed] [Google Scholar]
- 29.Mündermann A, Dyrby CO, D’Lima DD, Colwell CW, Andriacchi TP. In vivo knee loading characteristics during activities of daily living as measured by an instrumented total knee replacement. J Orthop Res. 2008;26:1167–1172. doi: 10.1002/jor.20655. [DOI] [PubMed] [Google Scholar]
- 30.Kutzner I, Trepczynski A, Heller MO, Bergmann G. Knee adduction moment and medial contact force-facts about their correlation during gait. PLoS One. 2013;8:8–15. doi: 10.1371/journal.pone.0081036. [DOI] [PMC free article] [PubMed] [Google Scholar]
- 31.Scopus. [cited 2015 Jun 2];Retrieval analysis of total knee prostheses: A method and its application to 48 total condylar prostheses (Article) [Internet] 2015 doi: 10.1002/jbm.820170510. Available from: http://www.scopus.com/record/display.url?eid=2-s2.0-0020826593&origin=resultslist. [DOI] [PubMed]
- 32.Harman MK, Banks SA, Hodge WA. Polyethylene damage and knee kinematics after total knee arthroplasty. Clin Orthop Relat Res. 2001;392:383–393. doi: 10.1097/00003086-200111000-00050. [DOI] [PubMed] [Google Scholar]
- 33.Tamura J, Clarke IC, Kawanabe K, Akagi M, Good VD, Williams PA, Masaoka T, Schroeder D, Oonishi H. Micro-wear patterns on UHMWPE tibial inserts in total knee joint simulation. J Biomed Mater Res. 2002;61(2):218–225. doi: 10.1002/jbm.10027. [DOI] [PubMed] [Google Scholar]
- 34.Sharkey PF, Hozack WJ, Rothman RH, Shastri S, Jacoby SM. Why are total knee arthroplasties failing today? Clin Orthop Relat Res. 2002;404:7–13. doi: 10.1097/00003086-200211000-00003. [DOI] [PubMed] [Google Scholar]
- 35.Sharkey PF, Lichstein PM, Shen C, Tokarski AT, Parvizi J. Why Are Total Knee Arthroplasties Failing Today-Has Anything Changed After 10 Years? J Arthroplasty. 2014;29(9):1774–1778. doi: 10.1016/j.arth.2013.07.024. [DOI] [PubMed] [Google Scholar]


