
Figure 3. Chronic food restriction decreases Gad1 colocalization in POMC neurons.
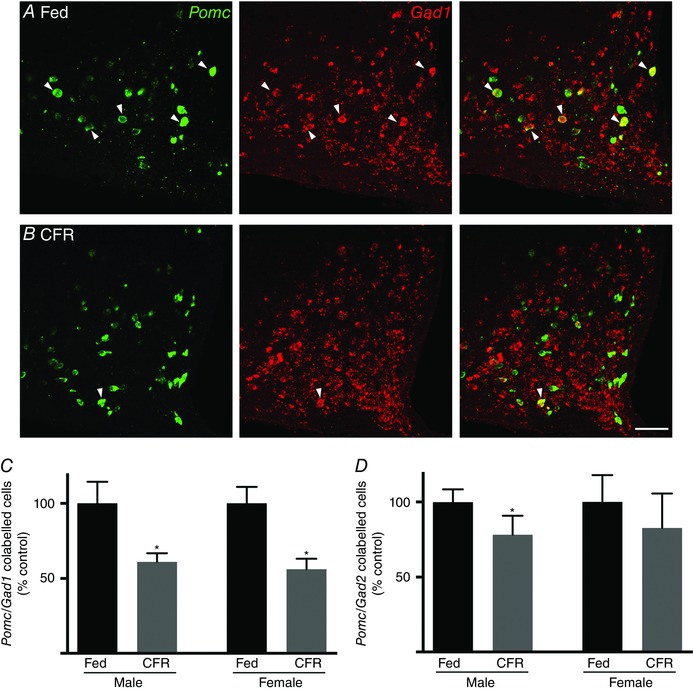
A and B, representative images showing Pomc mRNA (green) and Gad1 mRNA (red) in sections from an ad lib fed mouse (A) or a mouse that had been chronically food restricted (CFR, B). A merge of the left and centre images is shown in the far right image. White arrowheads indicate some of the double‐labelled cells. The scale bar in the lower right image is 50 μm. C and D, bar graphs showing the percentage of Pomc cells expressing Gad1 (C) or Gad2 mRNA (D) normalized to control in fed (black bars) and fasted mice (grey bars). * P < 0.05 compared to matched control group. n = 4–5 mice/group.