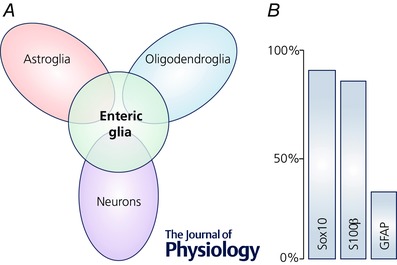
Figure 3. Gene expression in enteric glia.

A, transcriptional profile of enteric glia compared with the profiles of neurons and glia from the CNS (Rao et al. 2015). Not drawn to scale. B, expression of common markers for enteric glia estimated from Boesmans et al. (2015); co‐localization among the glial markers omitted for clarity.
