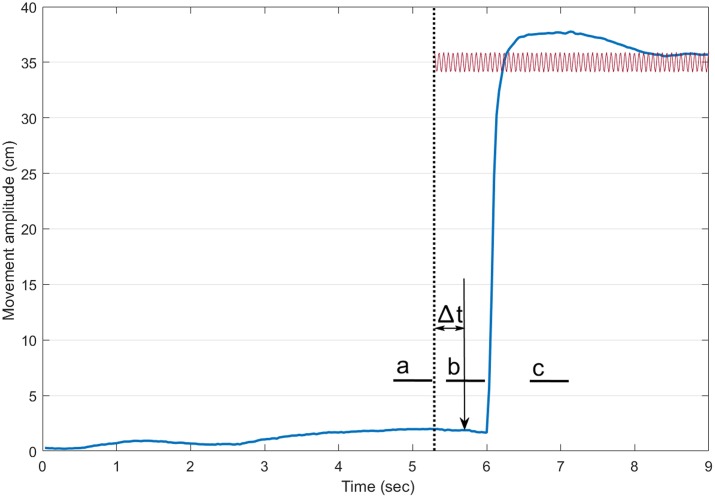
Figure 1.
Timeline of a trial with vibration. The thick blue line illustrates the index finger displacement. The dotted vertical line shows the onset of the vibration. The sound (vertical arrow pointing down) arrived 400 ms after the onset of the vibration. The small thick horizontal lines indicate the three 500-ms periods where the mean center of foot pressure (COP) position along the antero-posterior axis was computed (a: before the onset of the vibration, b: before the onset of the pointing movement and c: at the end of the pointing). For trials without vibration, a similar timeline was adopted.

