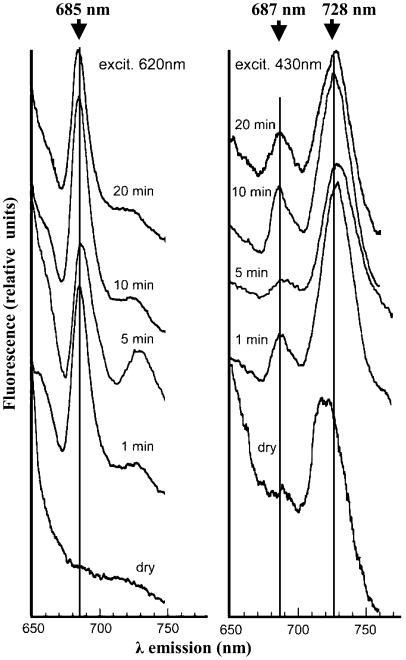
Figure 3.
The 77°K fluorescence emission spectra of crusts as a function of time of rehydration. Samples of crusts were frozen and excited at 620 nm (left) or 430 nm (right), respectively, before (dry) and after rehydration at room temperature and ambient light for 1, 5, 10, and 20 min, respectively. Vertical lines indicate wavelengths of maximal emission. These analyses were repeated four times with very little difference between the results obtained.

