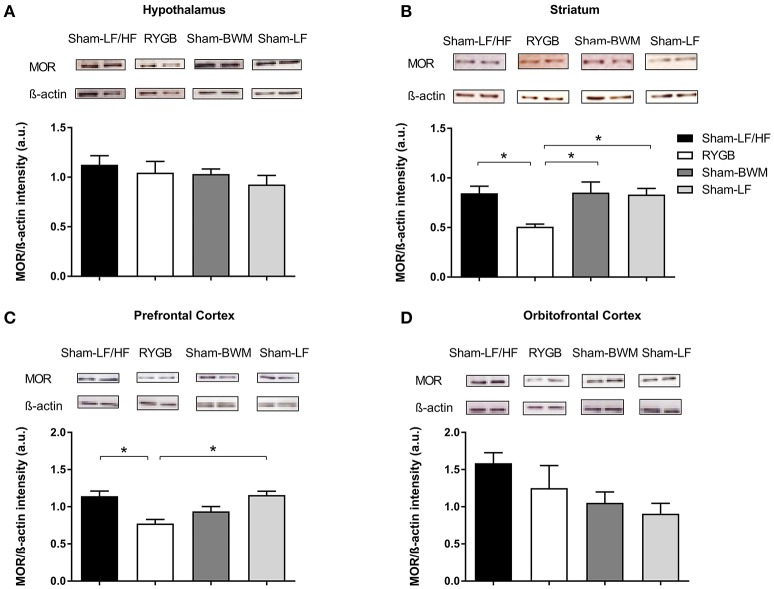
Figure 4.
Downregulation of striatal and prefrontal MOR protein levels at a stage of weight loss maintenance after RYGB in diet-induced obese male rats. At postoperative week 18, ad libitum fed Sham-LF/HF, RYGB, Sham-BWM, and Sham-LF rats were sacrificed and brains were collected for Western Blot analysis. Representative blots for MOR and β-actin in (A) hypothalamus, (B) striatum, (C) prefrontal cortex, and (D) orbitofrontal cortex for each group are presented. In (A–D), MOR protein expression was quantified by normalizing band signal intensity to that of β-actin. Data are presented as mean ± SEM. n = 3/4 per treatment group. *p < 0.05.

