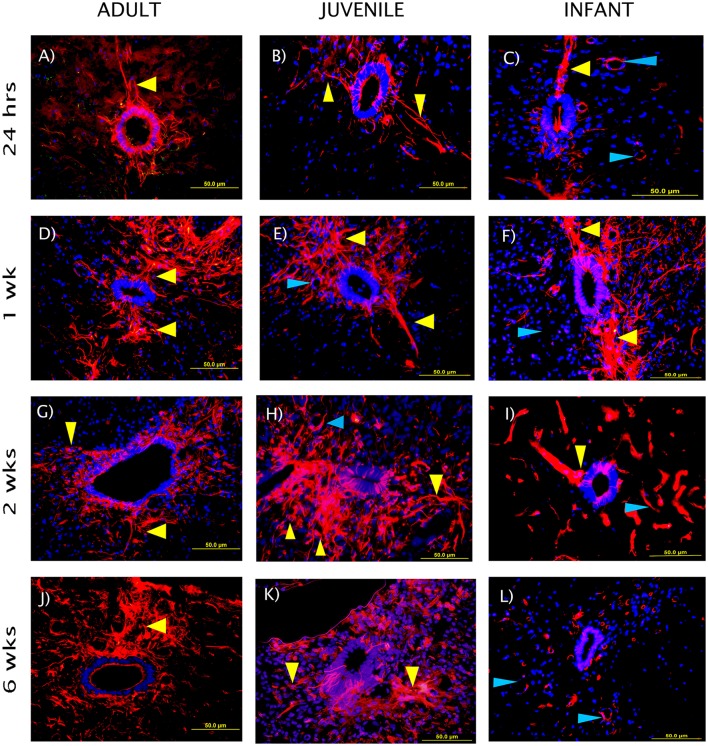
Figure 7.
Representative fluorescent microscopy images of the central canal taken at 400×, 2.25 mm distal to the lesion center, stained with nestin as a marker for endogenous neural progenitor cells (red). The nuclei are shown in blue. The ependymal layer of the central canal and long processes extending into the parenchyma can be seen (yellow arrows), some blood vessels are also visible as strongly nestin positive (blue arrows). The staining intensity in the infants is visibly lower than the adults and juveniles at the 2 and 6 week time points. (A–C) show the initial reaction at 24 h post-injury, (D–F) at 1 week, (G–I) at 2 weeks, and (J–L) depict the fading reaction at 6 weeks post-injury.

