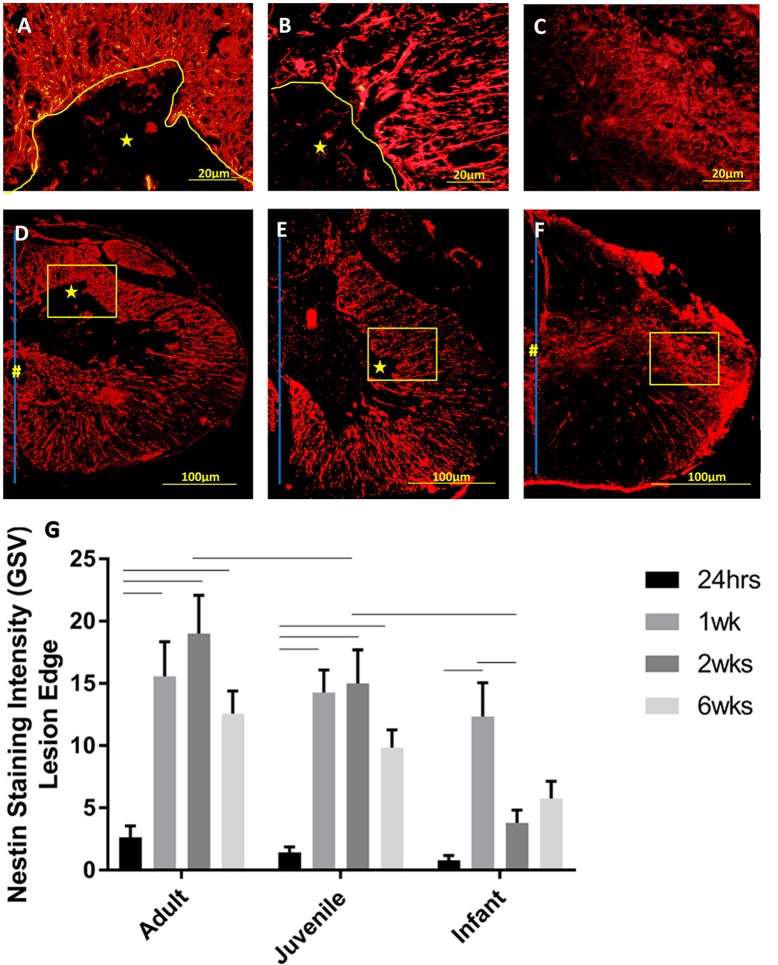
Figure 9.
Representative high power fluorescent images of nestin staining (red) at the lesion edge in (A) Adults, (B) Juveniles, and (C) Infants. These represent the areas denoted by the squares in low power images of one side of the transverse spinal cord shown in (D) Adults, (E) Juveniles, and (F) Infants 1 week post injury. The lesion is denoted by *, the central canal is indicated by # where it is intact, and the midline by the blue line. (G) Histogram of the intensity of nestin staining (mean grayscale value) indicating endogenous neural progenitor cells and processes around the edge of the lesion or cavity at 24 h, 1, 2, and 6 weeks post-injury. Using two-way ANOVA there was a significant difference (P < 0.0001) in both main effects, age and survival time. Significant differences (P < 0.005) are shown between groups based on Bonferroni's post-hoc test.

