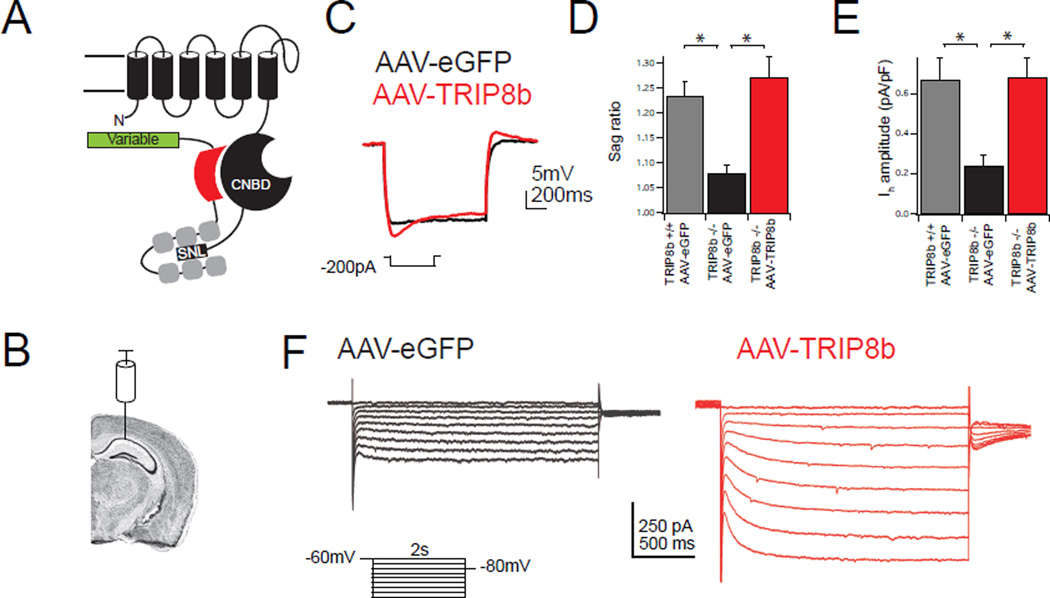
Figure 1. Viral expression of TRIP8b is sufficient to rescue Ih.
A.) Schematic of TRIP8b interacting with a single HCN pore-forming subunit. The N-terminal interaction occurs between the CNBD of HCN and an acidic stretch of amino acids in TRIP8b, schematized by a red shape. The C-terminal tail interaction occurs between the TPR domains of TRIP8b in gray and the ‘SNL’ tripeptide of HCN1, 2, and 4. The variably spliced N terminus of TRIP8b is represented by a green rectangle. B.) Schematic showing virus injection site. Coronal brain image generated using the Allen Mouse Brain Atlas34. C.) Whole-cell somatic recordings from eGFP-positive CA1 pyramidal neurons four weeks after bilateral viral injection into TRIP8b KO mice. Representative traces are shown during hyperpolarizing current injection. D.) Quantification of sag ratio. For reference, WT mice injected with AAV-eGFP are also shown (WT: 1.23±0.02, n=8; AAV-eGFP: 1.07±0.01, n=9; AAV-TRIP8b: 1.27±0.04, n=8; (F(2,22)=11.64, p<0.001). E.) Quantification of Ih amplitude from somatic voltage-clamp recordings from TRIP8b KO animals injected with the indicated viral construct (AAV-eGFP: 0.24±0.05pA/pF, n=9, AAV-TRIP8b: 0.68±0.10pA/pF, n=7). AAV-eGFP injected wild type mice are included for reference (0.67±0.11 pA, n=8; F(2,21)=7.92, p<0.01). F.) Representative voltage-clamp traces in response to hyperpolarizing voltage steps. All error bars represent ± s.e.m and are described above as mean ± s.e.m. *p<0.05 on Tukey’s test following one way ANOVA.

