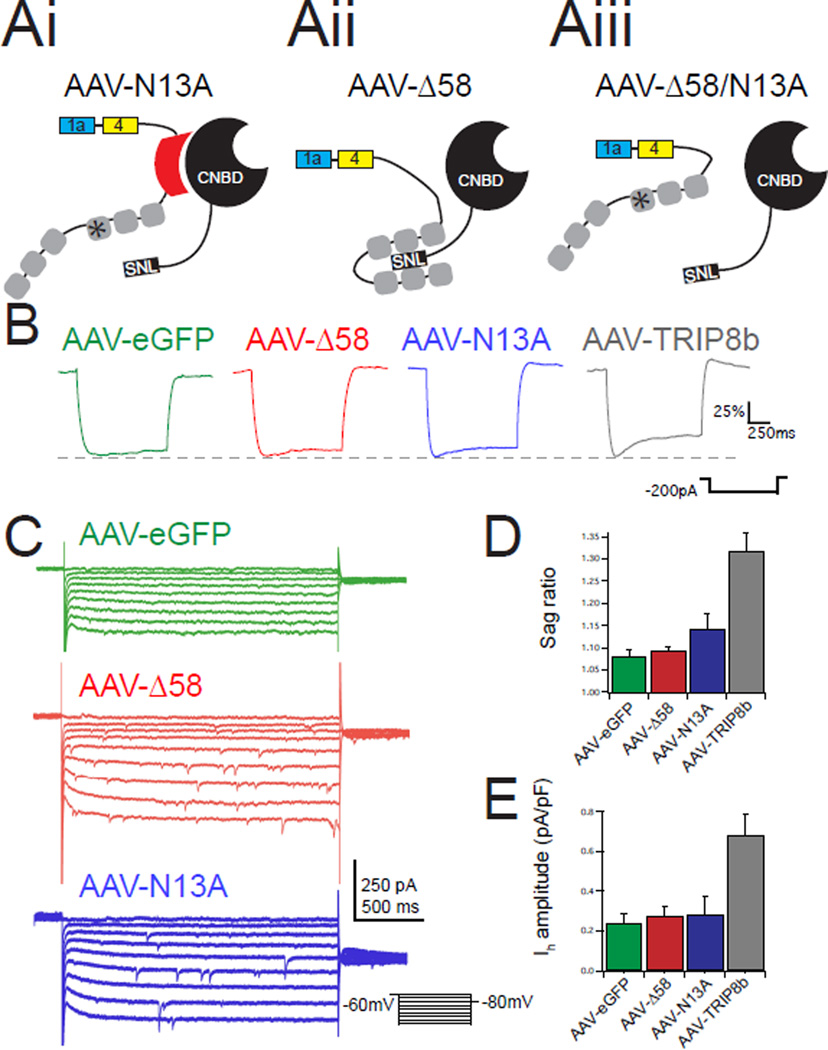
Figure 3. Loss of either TRIP8b-HCN binding site blocks viral rescue of Ih.
Ai–iii.) Schematic of mutant TRIP8b isoforms used showing predicted results of mutating either binding site. B.) Representative traces from EGFP-positive CA1 pyramidal neurons from each condition during hyperpolarizing current injections. Traces are scaled to ΔVmax to facilitate comparison of sag ratio. C.) Representative voltage-clamp recordings in response to hyperpolarizing voltage steps highlight slowly activating inward current. D.) Quantification of the sag ratio showed no difference by ANOVA (AAV-eGFP: 1.07±0.01, n=9; AAV-N13A: 1.11±0.02, n=7; AAV-Δ58: 1.09±0.01, n=6; F(2,19)=2.095, p>0.05). For comparison the sag ratio for AAV-TRIP8b infected neurons is reproduced from Figure 1. E.) Voltage-clamp measurements of Ih also showed no difference by ANOVA). (AAV-eGFP: 0.24±0.05 pA/pF, n=9; AAV-N13A: 0.282±0.09 pA/pF, n=7; AAV-Δ58: 0.27±0.04 pA/pF, n=5; F(2,19)=0.09, p>0.05). For comparison, the Ih amplitude from AAV-TRIP8b infected neurons is reproduced from Figure 1. All error bars represent ± standard error of the mean and are described above as mean ± s.e.m.

