
Fig. 2.
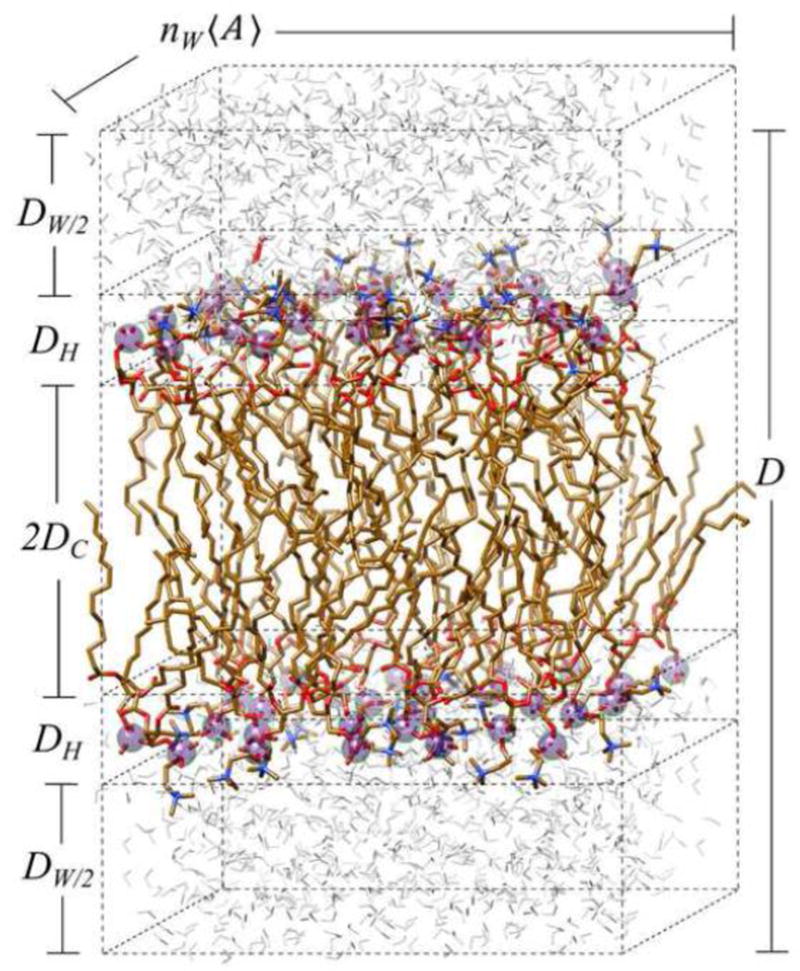
Lipid bilayer showing schematic depiction of unit cell and structural measures from obtained solid-state 2H NMR spectroscopy and small-angle X-ray scattering. Lamellar structure of the phospholipid membrane is shown with the pertinent structural quantities. The lamellar repeat spacing D = DW + DB is the sum of the interlamellar water distance DW = 2DW/2 and the bilayer thickness DB = 2(DH + DC). Here DC is the hydrocarbon thickness per bilayer leaflet and DH is the head group layer thickness. Bilayer dimensions involve the average cross-sectional area per lipid A, which together with the number of lipids (NL) give the overall surface area of the membrane. Changes in equilibrium structural quantities due to bilayer stress give a membrane-based view of the forces that underlie lipid interactions within the bilayer.