Fig. 1.
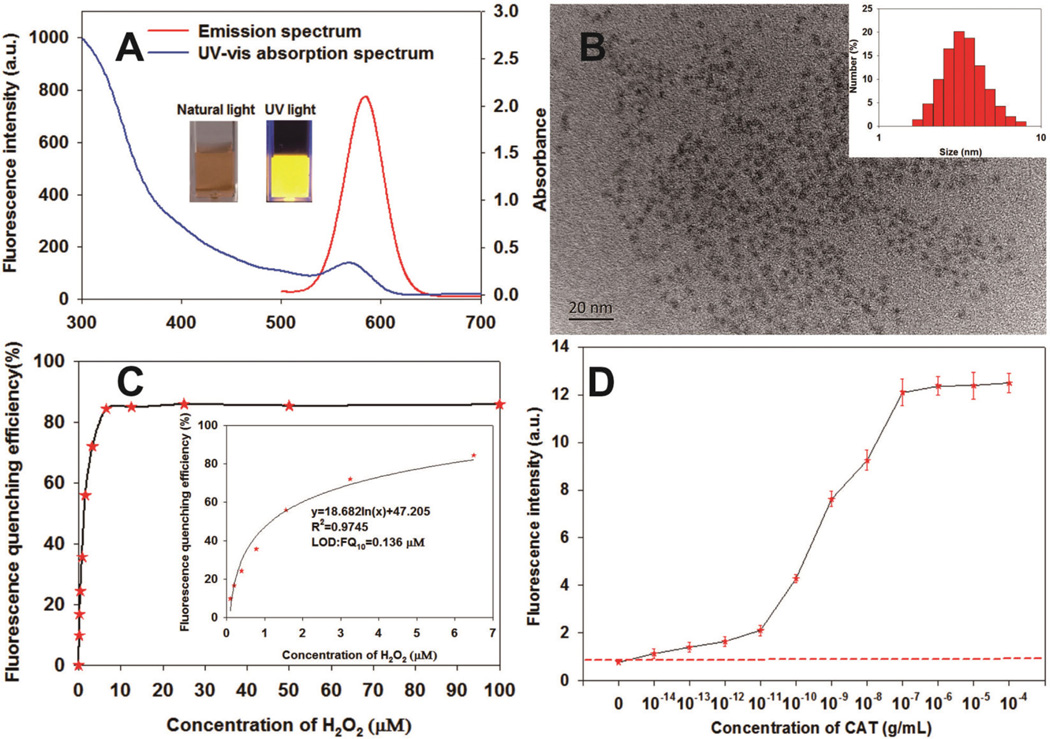
(A) Photoluminescence and UV-vis absorption spectra of CdTe QDs; the insets in (A) are the photographs of the CdTe QD solution under natural light (left) and UV light (365 nm) (right). (B) TEM image of the CdTe QD; the insets in (B) are the size distribution histograms of the CdTe QD. (C) Fluorescence changes upon the interaction of CdTe QD with different concentrations of H2O2 ranging from 0 to 100 µM. (D) Fluorescence changes upon the interaction of CdTe QD with different concentrations of CAT ranging from 0 to 10−4 g mL−1 in the presence of 10 µM H2O2. The red dashed line represents the blank fluorescence intensity plus 3 standard deviations. Thus, the LOD of CAT to the CdTe QDs was calculated as 10−14 g mL−1, which was defined as the lowest concentration of CAT that generated a higher fluorescence intensity than blank fluorescence intensity plus 3 standard deviations.

