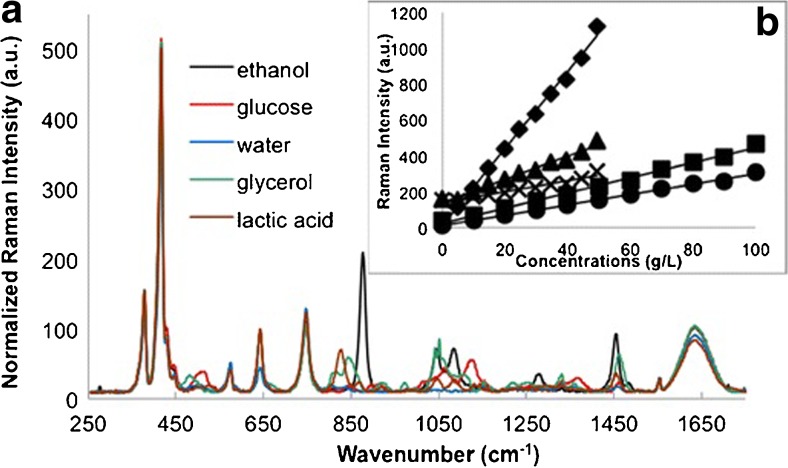
Fig. 3.
(a) Raman spectra after fluorescence corrections of reference components: ethanol, glucose, water, glycerol, and lactic acid, and (b) standard plot of baseline-corrected spectra for a simulated fermentation of 100 g/L glucose up to 50 g/L. Ethanol measured at 877 cm−1 (diamond), y = 21.406x + 12.553, R2 = 0.9959; 1046 cm−1 (multiplication sign), y = 3.0716x + 138.07, R2 = 0.9569 at 1455 cm − 1 (triangle), y = 6.4871x + 138.52, R2 = 0.984. Glucose measured at 514 cm−1 (circle), y = 2.8793x + 11.362, R2 = 0.9973, and 1,123 cm−1 (square), y = 4.2116x + 24.177, R2 = 0.994. Reprinted with permission from Iversen, Jens A., Rolf W. Berg, and Birgitte K. Ahring. “Quantitative Monitoring of Yeast Fermentation Using Raman Spectroscopy.” Analytical and Bioanalytical Chemistry 406, no. 20 (2014): 4911–4019. doi:10.1007/s00216-014-7897-2. Copyright 2014 Springer.

