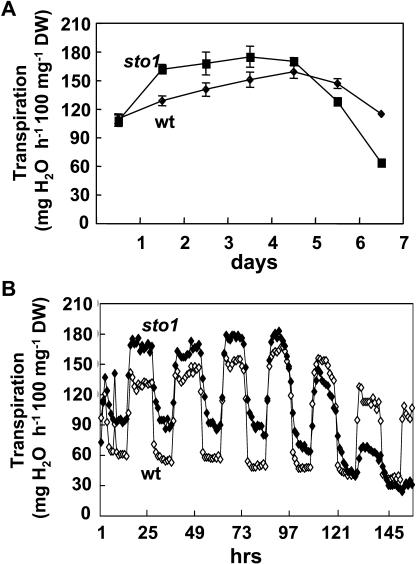
Figure 13.
Transpiration of wild-type and sto1/nced3 mutant plants. A, Transpiration of wild-type and sto1/nced3 mutant plants was measured as daily water loss over a 7-d time interval. Each value represents the average daily water loss of three plants ± se. B, Daily fluctuations of rate of water loss in wild-type and sto1/nced3 mutant plants. The diurnal patterns displayed are representative of three independent experiments.

