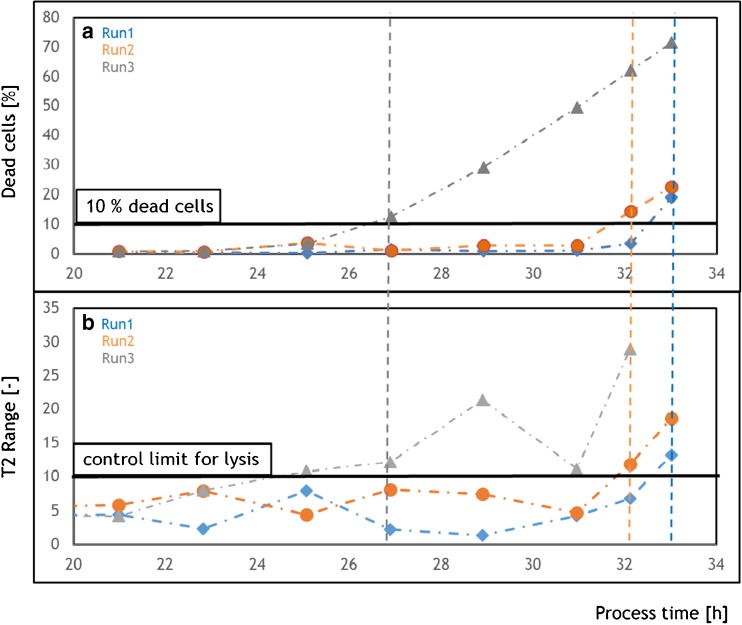
Fig. 2.
FCM offline data and the Hotelling’s T2 statistics for the three E. coli bioprocesses. a FCM data depicting cell death over process time; b Hotelling’s T2 statistics from the PCA model developed with chromatogram fingerprints at 260 nm over process time. Blue diamonds, Run1; orange circles, Run2; and,gray triangles, Run3. Dotted line, process deviation from control limit

