
Fig. 13.
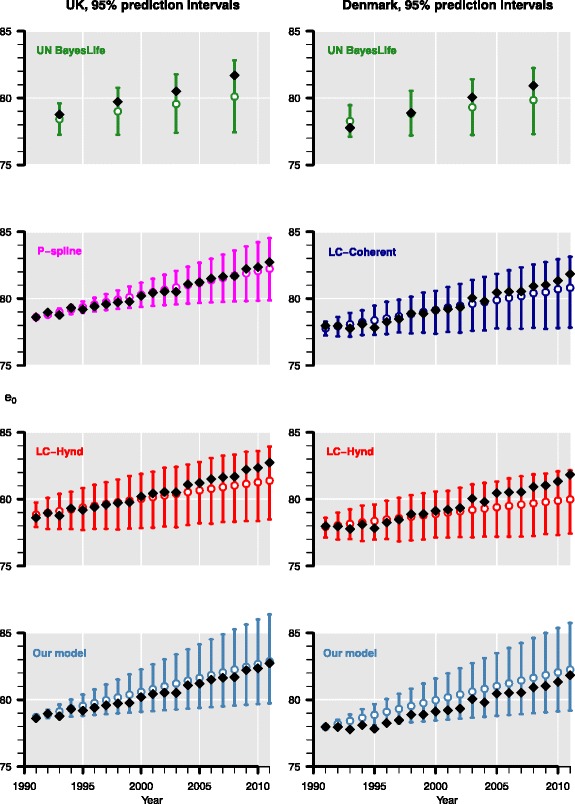
Validating forecasts from 1991 to 2011, given data from 1965 to 1990, of our model (blue), the LC model (red), its coherent variant (dark blue), the P-spline method (magenta), and of the UN Bayesian approach (green) for British (left) and Danish (right) women. Observed life expectancy (e 0) is represented by black squares, the median forecasts by white circles, and the 95% prediction intervals by the vertical lines. We combine the mortality trends of Danish and Swedish women in our model as well as in the coherent LC model