
Fig. 17.
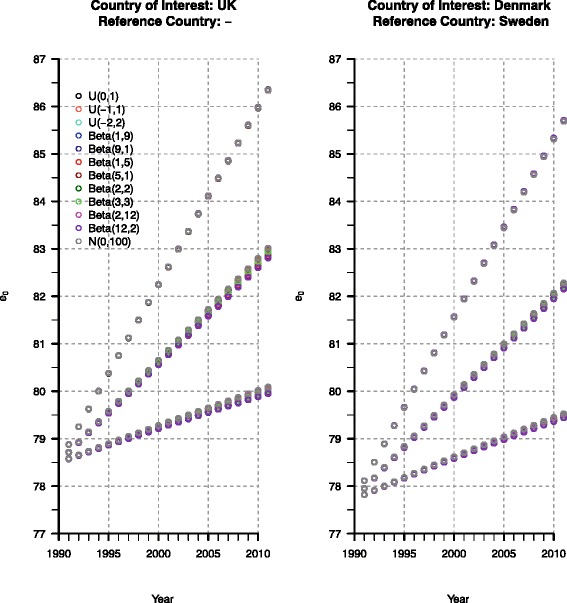
Prior sensitivity analysis: the validating forecasts (represented by the median and the 80% prediction intervals) of British (left) and Danish (right) life expectancy are (very) similar, although we use different prior specifications (differently colored circles) for our model