
Fig. 3.
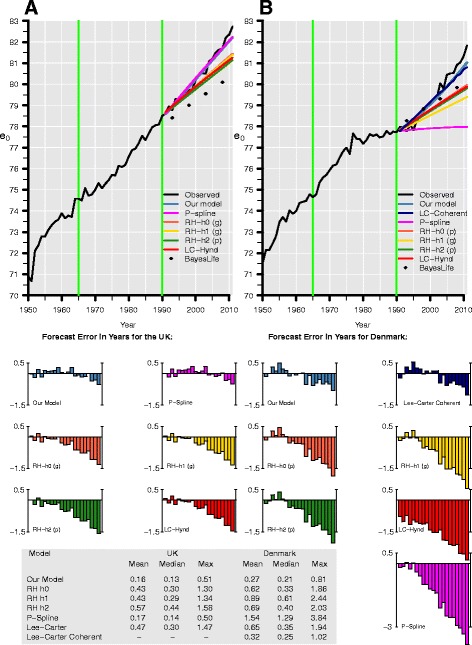
Observed (black line) and forecasted life expectancy at birth (e 0) of our model (blue), the P-spline approach (magenta), the LC model (red), four of its variants—h0 (light red), h1 (yellow), h2 (green), and coherent (navy blue—and of the UN Bayesian approach (squares) for women in the UK (left) and Denmark (right). The validating forecasts from 1991 to 2011 rely on data from 1965 to 1990 (green vertical lines). We combine the mortality trends of Danish and Swedish women in our model as well as in the coherent LC forecast. In the RH models, (p) and (g) denote Poisson and Gaussian errors, respectively. Forecast errors are shown for all forecasts