Fig. 7.

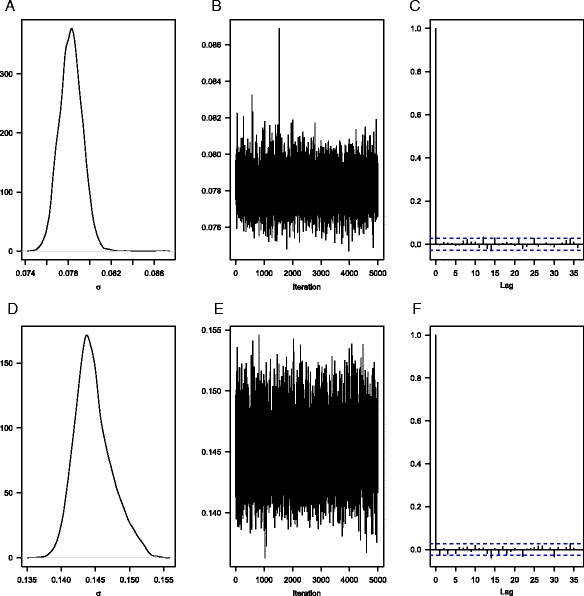
Marginal posterior density function (a, d), traceplot (b, e), and autocorrelation function (c, f) for the parameter σ in the British (top: a–c) and Danish (bottom: d–f) validating forecast of our model after 5000 iterations

Marginal posterior density function (a, d), traceplot (b, e), and autocorrelation function (c, f) for the parameter σ in the British (top: a–c) and Danish (bottom: d–f) validating forecast of our model after 5000 iterations