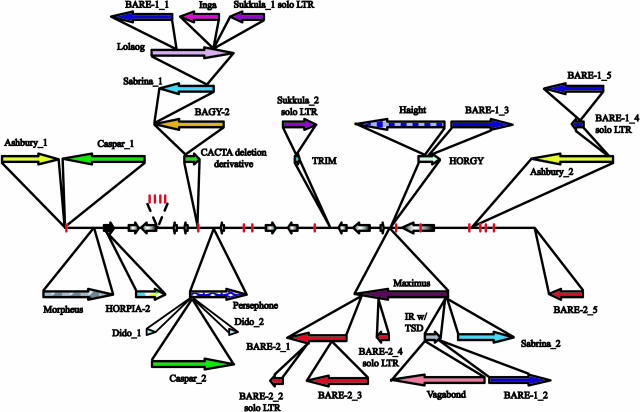
Figure 2.
Stacked representation of the genome organization of the region containing the Ha locus in barley. Arrows directly on the “base” sequence represent putative genes; designation can be seen in Figure 1. Arrows above and below the base sequence represent the position, orientation, and order of insertion of various transposable elements. Vertical bars illustrate MITES.

