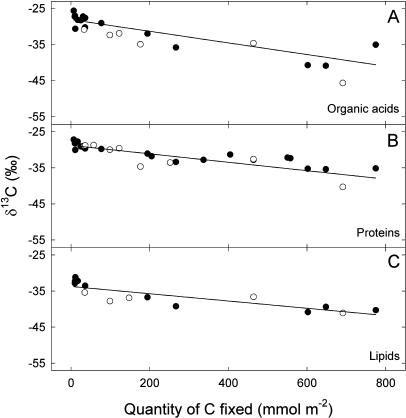
Figure 4.
Changes in the δ13C (‰) of the organic acids (A), heat-precipitated proteins (B), and lipids (C) as a function of the quantity of carbon fixed by French bean leaves. Plants were taken directly from the greenhouse (nonstarved plants, black symbols) or kept in the dark for 3 d (starved plants, white symbols) before the labeling. Each point represents data from a separate leaf.

