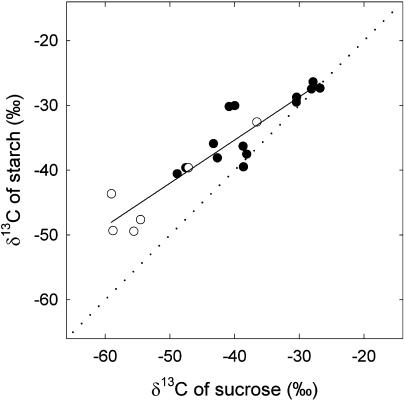
Figure 5.
δ13C of starch and Suc after labeling of French bean leaves. Plants were taken directly from the greenhouse (nonstarved plants, black symbols) or kept in the dark for 3 d (starved plants, white symbols) before the labeling. Each point represents data from a separate leaf. The regression line is obtained with all data in the plot. The regression is y = 0.66x − 8.69, r2 = 0.85. The regression is significant (F = 105.2; P < 0.0001).

