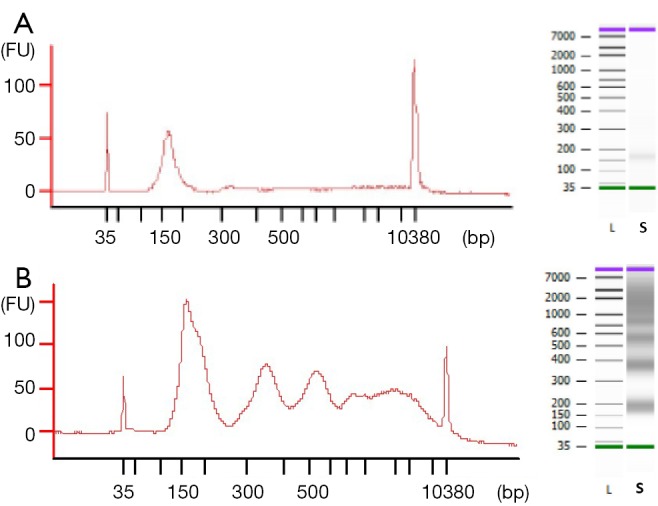
Figure 1.

Electropherogram and gel-like image of cfDNA samples. (A) 180 bp peak corresponding to low fragment cfDNA and (B) peaks corresponding to mono-, di- tri-nucleosomes and long fragment cfDNA. FU, fluorescence units; L, leader; S, sample; cfDNA, circulating free DNA.
