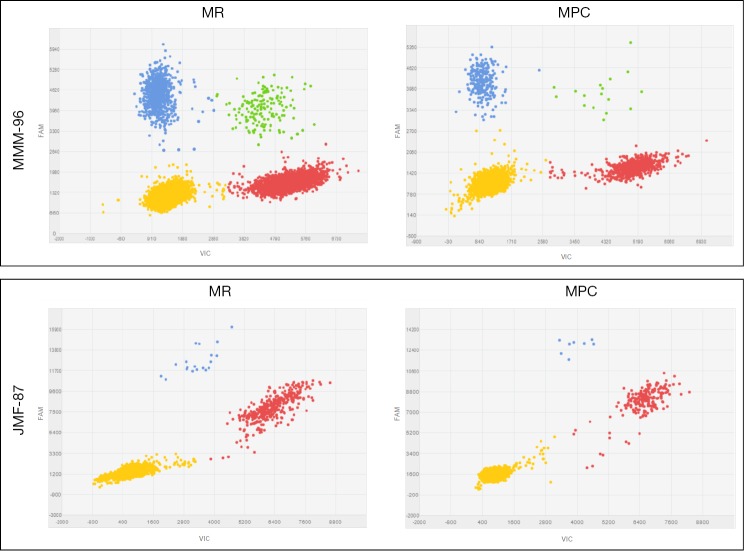
Figure 2.
Representative scatter plots for tumor mutation quantification on paired cfDNA samples extracted by MPC and MR methods. (A) Patient MMM-96, the p.E746_A750delELREA mutation is labeled with FAM (blue data points) whereas wild-type cfDNA is labeled with VIC (red data points); (B) patient JMF-87, p.T790M mutation is labeled with FAM and wild-type cfDNA is labeled with VIC. cfDNA, circulating free DNA; MPC, MagNA Pure Compact; MR, Maxwell® RSC.

