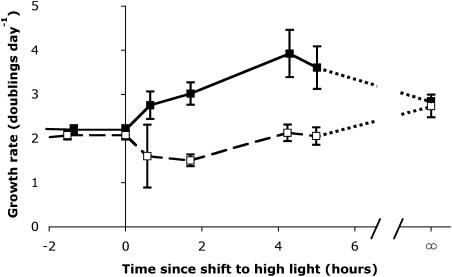
Figure 2.
Growth rates of high-Ci (black symbols, solid line) and low-Ci (white symbols, dashed line) cultures of S. elongatus measured at various times (x axis) relative to the shift from LL (50 μmol m−2 s−1; time <0) to HL (500 μmol m−2 s−1; time >0). The growth rates of separate cultures grown continuously under HL are shown at time = ∞, and connected to the light-shifted cells by dotted lines (values are means, n = 6 ± SEM).

