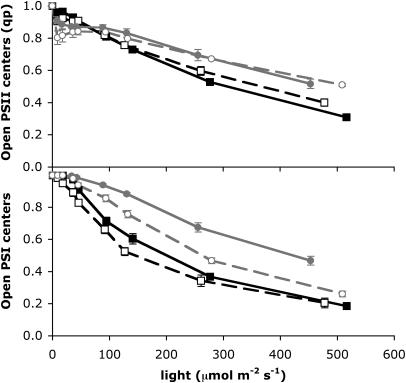
Figure 4.
Openness or fraction of photosystems available for photosynthesis in PSII and PSI. High-Ci (black symbols, solid line) and low-Ci (white symbols, dashed line) light response curves are shown for cells grown at LL (50 μmol m−2 s−1; black squares) and 6 h after shifting to HL (500 μmol m−2 s−1; gray circles). Values are means, n = 6 ± SEM.

