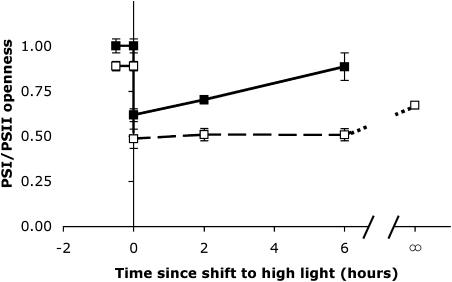
Figure 5.
Balance of photosystem openness in high-Ci (black symbols, solid line) and low-Ci (white symbols, dashed line) cells measured at various times (x axis) relative to the shift from LL (50 μmol m−2 s−1; time <0) to HL (μmol m−2 s−1; time >0). The growth rates of separate cultures grown under HL continuously are shown at time = ∞, and connected to the light-shifted cells by the dotted line (values are means, n = 6 ± SEM). A continuous light value for high-Ci cells could not be calculated because the weak P700 absorbance values did not allow accurate PSI openness calculations. The error bars on some samples are smaller than the symbol size and thus are not visible.

