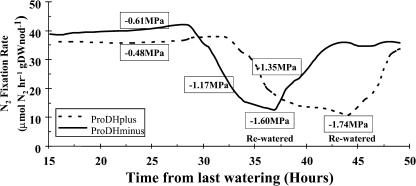
Figure 4.
A typical experiment showing N2 fixation rates over time after withholding water and during recovery after rewatering. This experiment was done 40 DAP. Results with plants inoculated with the parental strain (ProDH+) are indicated by the dashed line, and those inoculated with the ProDH− strain are indicated by the solid line. Values of ΨL at different times during the experiment are indicated in the boxes. The average value of ΨL for well-watered plants was −0.63 ± 0.01 MPa (n = 55).

