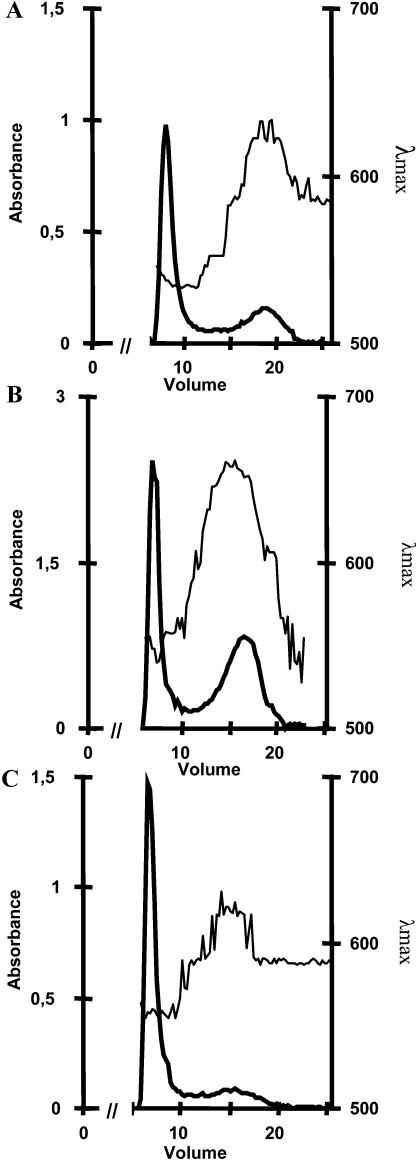
Figure 1.
Separation of amylose and amylopectin CL2B gel permeation chromatography of starch from O. tauri (1 mg) dispersed in 10 mm NaOH (A) in comparison with C. reinhardtii (2 mg; B) and Arabidopsis (1 mg; C). The λmax (wavelength of the maximal absorbance of the iodine-polysaccharide complex in nanometers) is scaled on the right axis. The absorbency of the complex at λmax measured for each fraction is indicated on the left axis. The low λmax fraction excluded from the column defines amylopectin, while the high λmax amylose is separated throughout the column. The x axis shows the elution volume in milliliters.

