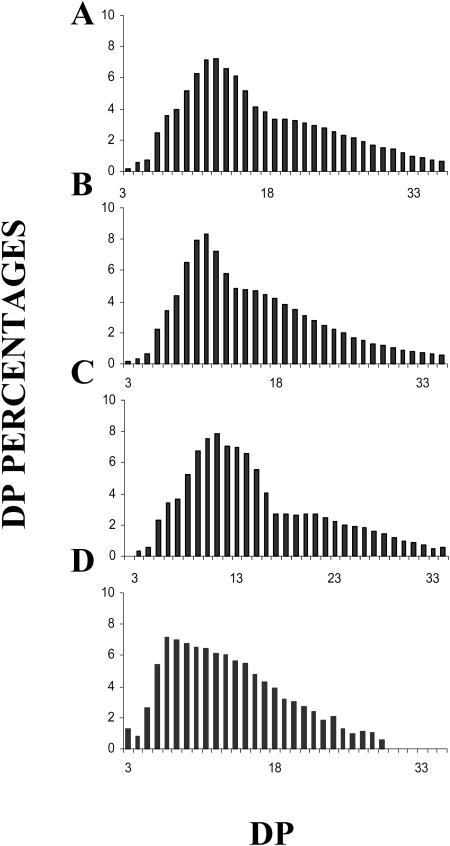
Figure 2.
Polysaccharide CL distributions. Histograms of CL distributions obtained after isoamylase-mediated enzymatic debranching through capillary electrophoresis of 8-amino-1,3,6-pyrenetrisulfonic acid-labeled fluorescent glucans. The x axis displays degree of polymerization scales (DP 3–35) and the y axis represents the relative frequency of chains expressed as percentages. A, CL distribution of purified amylopectin from O. tauri. B and C, CL distribution of purified amylopectin from Arabidopsis (B) and C. reinhardtii (C) wild-type references. D, Bovine liver glycogen CL distribution.

