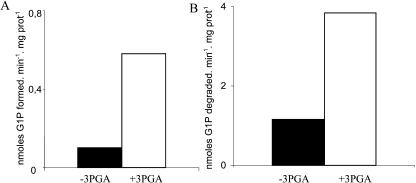
Figure 3.
Histograms of ADP-Glc pyrophosphorylase activity. A displays the assay in the nonphysiological direction of pyrophophorolysis in the presence (white box) or absence (black box) of 1 mm 3PGA. Units are expressed in nanomoles of Glc-1-P formed per minute and per milligram of protein. B represents the activity of ADP-Glc pyrophosphorylase in the direction of ADP-Glc synthesis in the presence or absence of 1 mm activator. Units are expressed in nanomoles of Glc-1-P degraded per minute and per milligram of protein.

