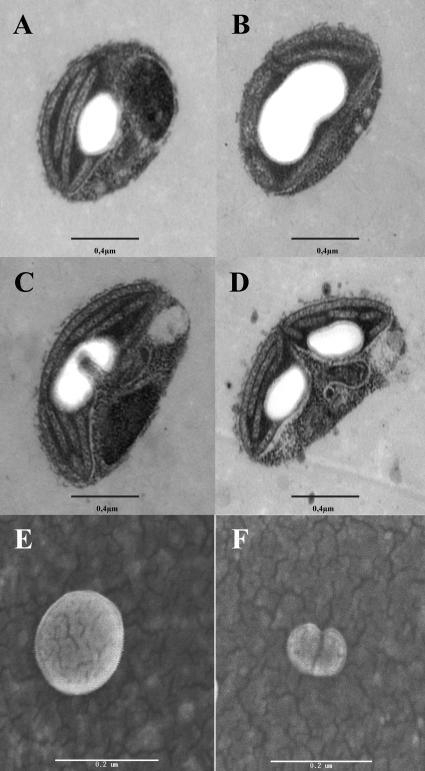
Figure 6.
Micrographs of dividing starch granule in O. tauri. A to D, TEM of dividing O. tauri cells. Poorly synchronized cultures contain a mixture of cells at different stages of plastid division (bar = 0.4 μm). E and F, Field emission type SEM images of dividing starch granule purified from synchronized cultures. Starch granules isolated from G1 cells (E) and G2/M-phase (F). Cultures were synchronized by 12-h-day/12-h-night growth cycles. G1 granules always appear spherical with a somewhat smoother surface, while G2/M starch granules are small often compounded with a rough surface (bar = 0.2 μm).

