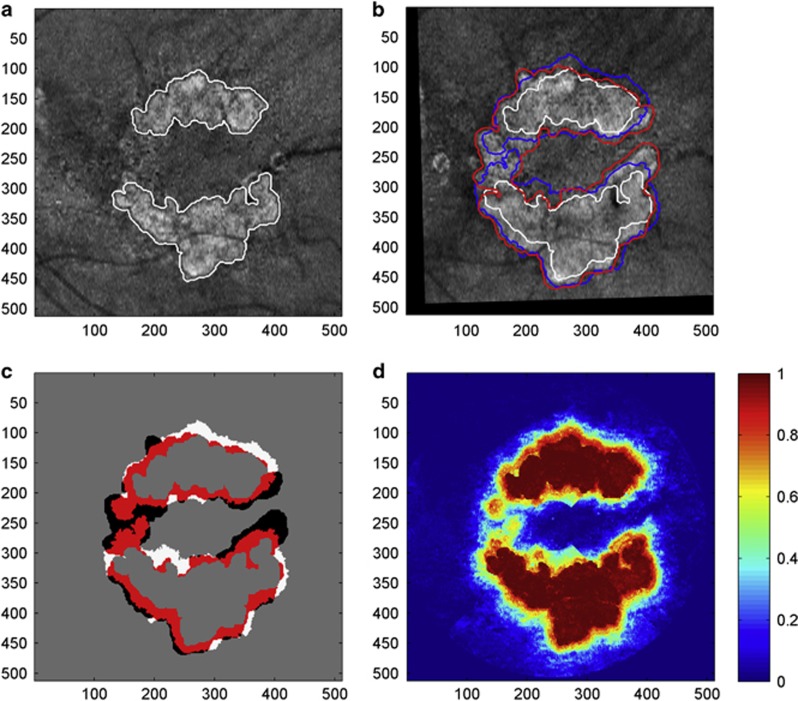
Figure 10.
Fully automated prediction of GA growth from a baseline observation. (a) OCT fundus image of GA at baseline with automatically segmented GA outlined in white. (b) OCT fundus image of GA obtained 12 months from baseline. Baseline GA region shown in white, observed GA region at follow-up shown in red, predicted GA region shown in blue. (c) Comparison of predicted and observed results. The red and white regions depict the correctly predicted (true-positive) and incorrectly predicted (false-positive) regions, respectively. Black regions correspond to false-negative results. (d) Classification probability obtained from the evaluation of the baseline scan. (Figure from Niu et al98).

