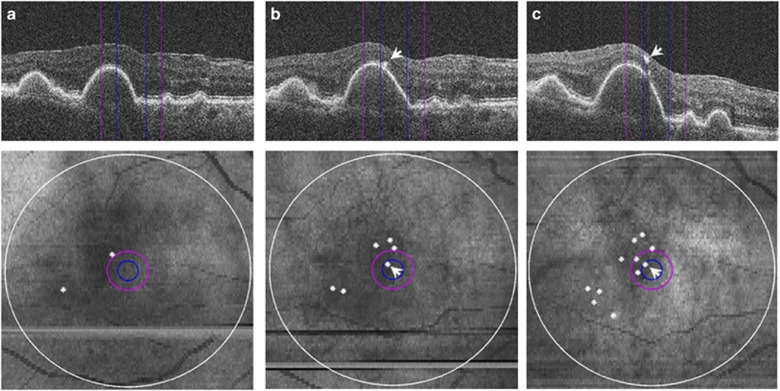
Figure 3.
SD-OCT visualization of hyper-reflective foci proliferation and migration toward inner retinal layers. Magnified SD-OCT images (top) and corresponding SD-OCT-derived retinal maps (bottom). 500-μm, 1-mm, and 6-mm fields are indicated by blue, purple, and white circles, respectively. (a) baseline; (b) 1-year follow-up; (c) 2-year follow-up. Progressive migration of hyper-reflective foci (arrowheads) and their proliferation (white dots) can be observed. (Figure from Christenbury et al19).

