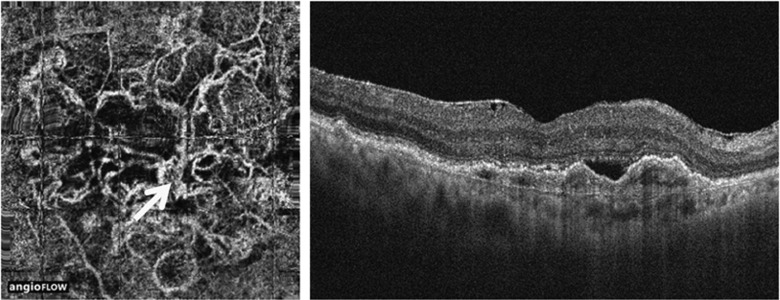
Figure 5.
Type 1 CNV in neovascular AMD, visualized by OCT angiography. Left image shows OCT angiography visualization of the neovascular complex. Right image shows conventional intensity image of a fibrovascular PED harboring CNV. (Figure from Kuehlewein et al39).

