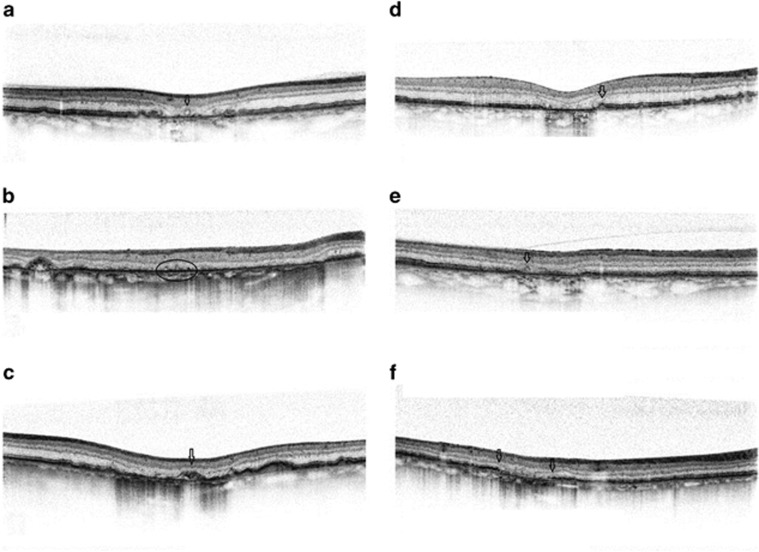
Figure 9.
Microstructural alterations in the region of GA and junctional zones, visualized by SD-OCT. GA appears as a loss of RPE and presents a hyper-reflective signal in the choroid. Arrows/circle mark outer retinal tubulation (ORT) in panels (a and e), irregular elevations of the RPE–BM complex in panel (b), crown-like elevations with debris beneath in panel (c), dome-shaped RPE elevation in panel (d), and splitting of the RPE–BM complex in panel (f).

