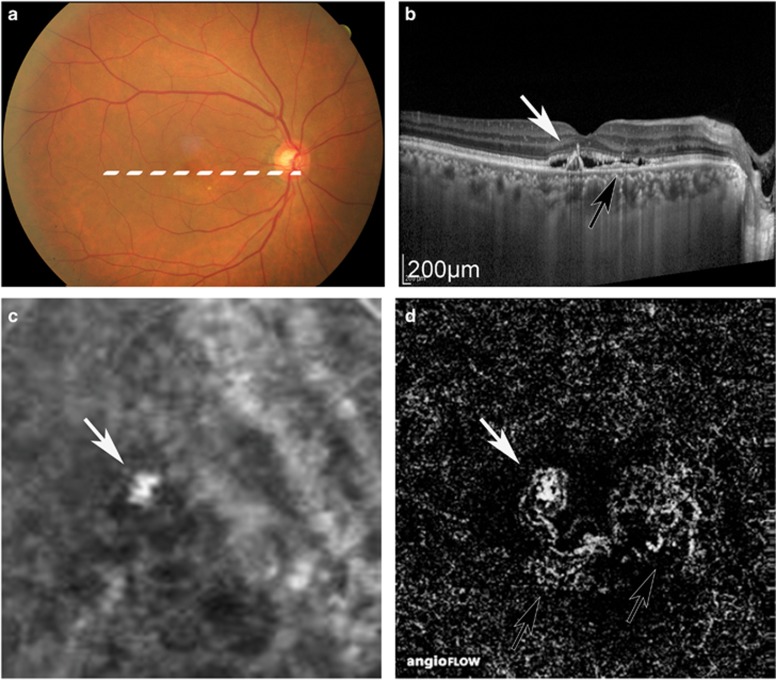
Figure 2.
Case 11, in which ICGA could detect only PL, although OCTA detected PL and BVN. Colour fundus (a), OCT image (b), ICGA image (c), and OCTA image (d). White arrow: PL. Black arrow: BVN. In the ICGA image, BVN was unclear, although it appeared clearly in the OCTA images. The PAs were 0.20 mm2 in ICGA and 0.19 mm2 in OCTA.

