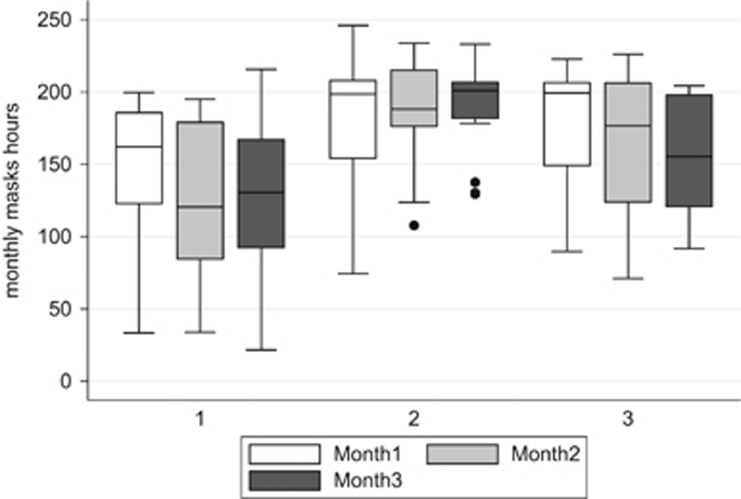
Figure 2.
Boxplots for total hours of mask wear in those participants (Group A n=17, Group B n=17, and Group c n=12) who completed 3 months of the study. Median is shown as horizontal line with upper and lower quartile as box, and range minima and maxima at ends of vertical lines; outliers with single months with reduced mask wear shown as single points (patient 29 108 h in month 2, patient 31 138 h in month 3, and patient 34 129 h in month 3).

