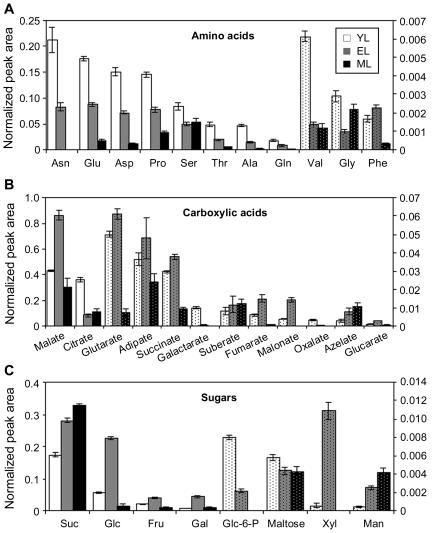
Figure 2.
Histogram of highly represented metabolite classes in YL (white bars), EL (gray bars), and ML (black bars) aspen tissues. A, Amino acids; B, carboxylic acids; C, soluble carbohydrates. Solid-shade bars are scaled against the left axis and dotted histogram bars are scaled against the right axis. Error bars represent se of means of n = 30 determinations.

