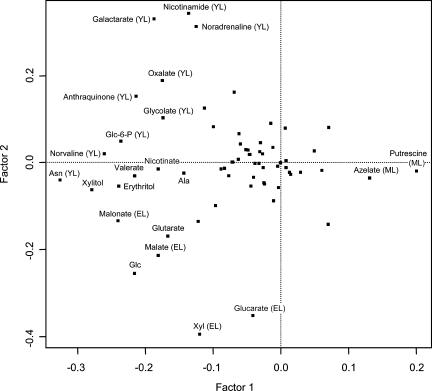
Figure 4.
Scatter plot representation of the contribution of individual metabolites to principal component clustering of YL, EL, and ML tissue samples. Metabolites plotting farthest from the intersection of the principal component axes contributed most to tissue clustering and were identified by common name. Metabolites marked YL, EL, or ML were most abundant in those tissues, respectively.

