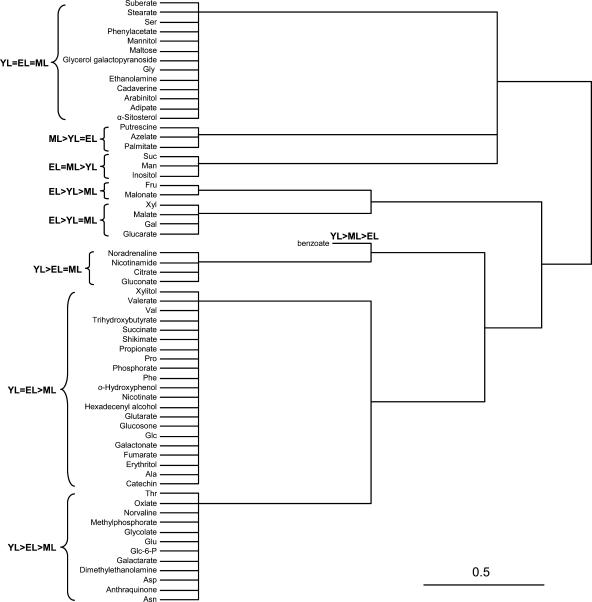
Figure 5.
HCA dendrogram grouping of metabolites based on significant differences in relative abundance in YL, EL, and ML tissues. Fisher's lsd mean comparison was used to rank the tissue abundance of each metabolite (see text). The average linkage method was used to group data by Euclidian distance relatedness.

