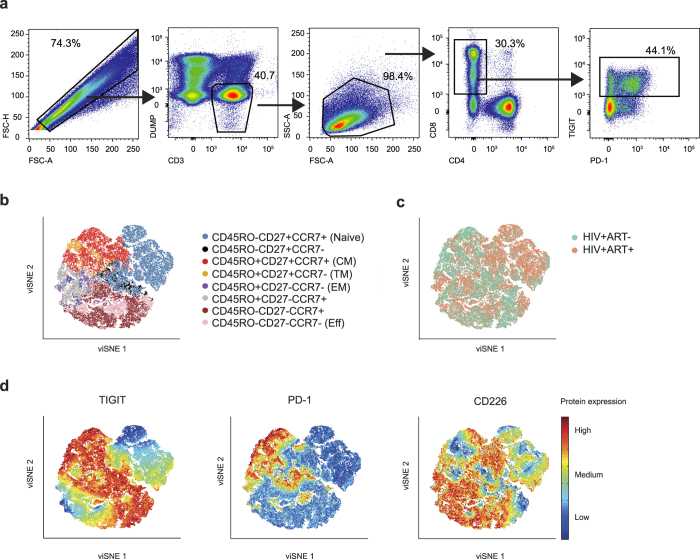
Figure 1. Expression patterns of TIGIT, PD-1 and CD226 on naïve/memory CD8+ T cells.
(a) Gating strategy for TIGIT expression on CD8+ T cells in a representative subject. (b) viSNE map of naïve/memory phenotype distribution (based on CD45RO, CCR7 and CD27) in HIV+ subjects. Colors depict memory phenotypes. (c) Distribution of cells based on treatment status, HIV+ART− (green, n = 6) and HIV+ART+ (orange, n = 6) based on memory populations shown in (b). (d) Distribution of TIGIT, PD-1 and CD226 based on memory populations shown in (b). Colors depict intensity of protein expression.

