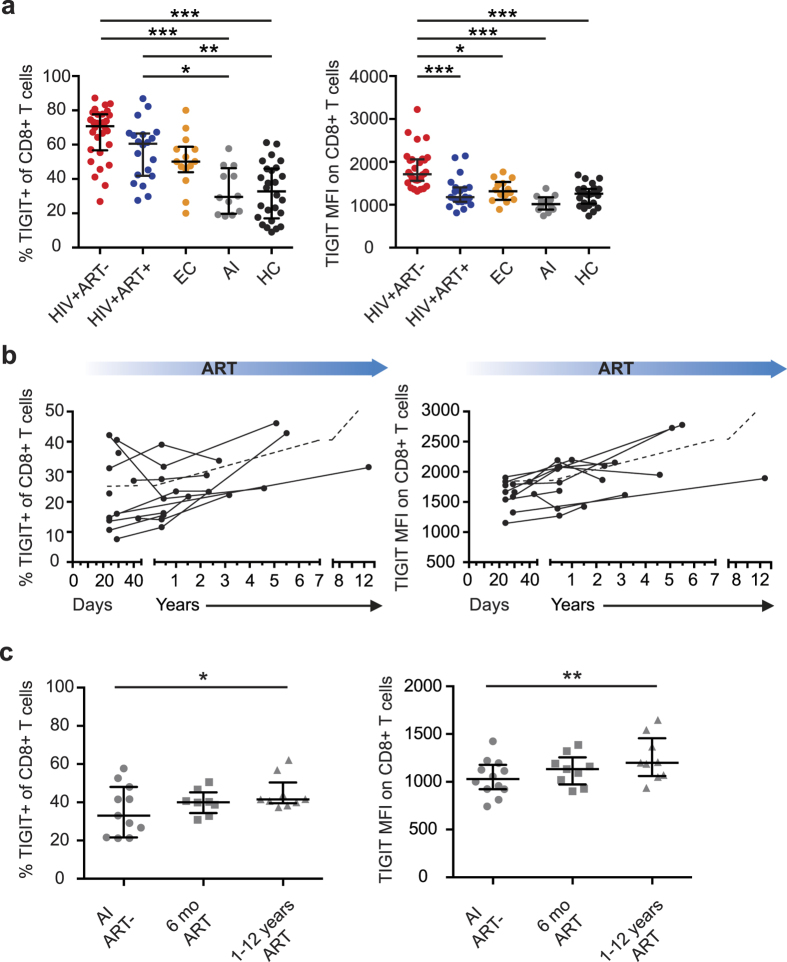
Figure 2.
Expression of TIGIT on CD8+ T cells in HIV-positive subjects before and after ART (a) Frequency and MFI of TIGIT on CD8+ T cells in HIV+ treatment naïve (HIV+ART−, n = 30), long term treated (HIV+ART+, n = 20), elite controller (EC, n = 14), acutely infected (AI, n = 12) subjects and healthy controls (HC, n = 26). (b) Frequency and MFI of TIGIT on total CD8+ T cells over time in subjects followed from acute HIV infection (n = 12). Blue arrows indicate ART. (c) Frequency of TIGIT+ cells and TIGIT MFI on CD8+ T cells in subjects followed from acute HIV infection to chronic infection (n = 12). Circles represent acute HIV infection, squares represent the timepoint 6 months after ART initiation and triangles represent the timepoint 1–12 years after ART initiation. One-way ANOVA followed by Kruskall-Wallis test and Dunn’s multiple comparisons test were used to compare between ≥3 groups. The Wilcoxon matched-pairs signed rank test was used to compare paired samples. The Spearman non-parametric test was used for correlation analysis. *P < 0.05, **P < 0.01 and ***P < 0.001.

