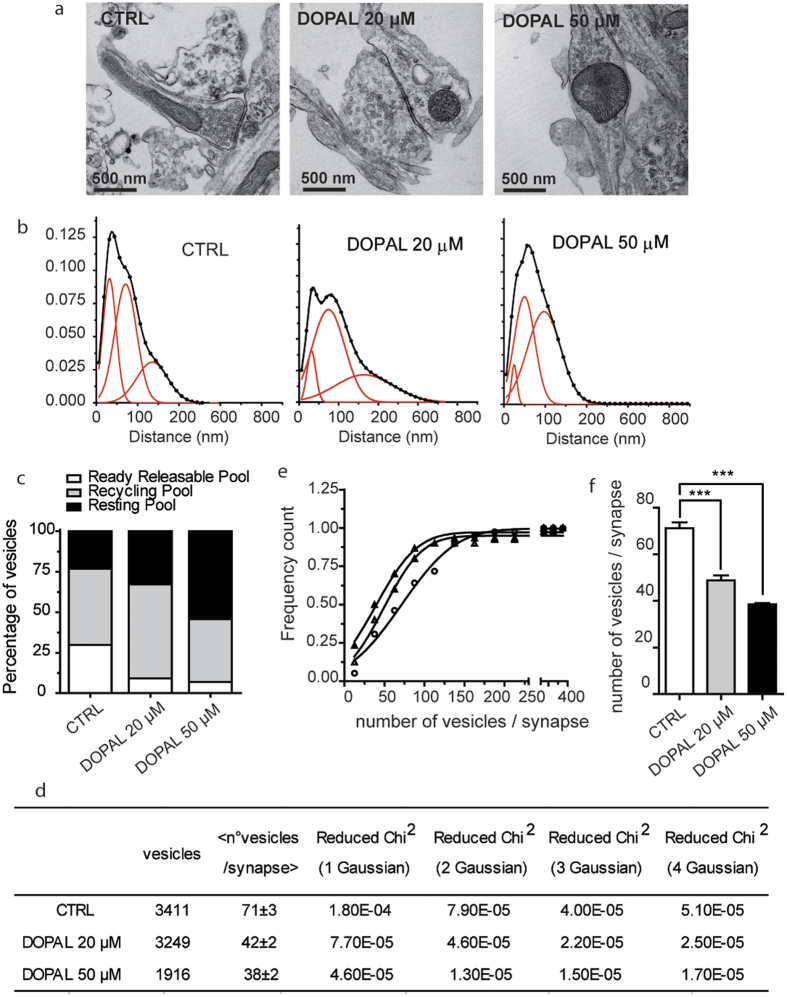
Figure 2. DOPAL effect on synaptic vesicles in primary mouse neurons.
(a) TEM images of mice primary neurons synapses not treated (CTRL) and treated with 20 μM and 50 μM DOPAL. (b) Frequency distribution of vesicles distance from the active zone of primary neurons in control, treated with 20 μM and 50 μM DOPAL (from left to right). Data were fitted with a three Gaussian function (OriginPro8). The dots represent the experimental points, the black continuous line is the best fit generated by sum of the contributing Gaussian curves (red continuous lines). (c) Grouped stack column plot of the percentage of area under curve of the three vesicle populations, representing the percentage of vesicles belonging to the ready-releasable (white), recycling (grey) and resting (black) pools in control neurons and in neurons treated with 20 μM and 50 μM DOPAL. (d) Summary of the parameters derived from the TEM images analysis: number of total vesicles, number of total synapses, average number of vesicles per synapse, and the value of the reduced Chi-Squared for fits with one, two, three and four Gaussian curves (OriginPro8), suggesting that the best fit is the one with three Gaussian curves. (e) Cumulative distributions of the number of vesicles per synapse show that the number of vesicles per synapse is higher in controls (full triangle) than in neurons treated with 20 μM and 50 μM DOPAL (empty triangles and empty circles, respectively). (f) Histograms representing the average inflection point values of the cumulative distribution of the number of vesicles/synapse showing a significant reduction after 20 μM and 50 μM DOPAL treatment. Bars represent mean ± SEM from n = 30–39 synapses from at least three independent experiments. Asterisks indicate statistical significance by two-way ANOVA (***p < 0.001).

