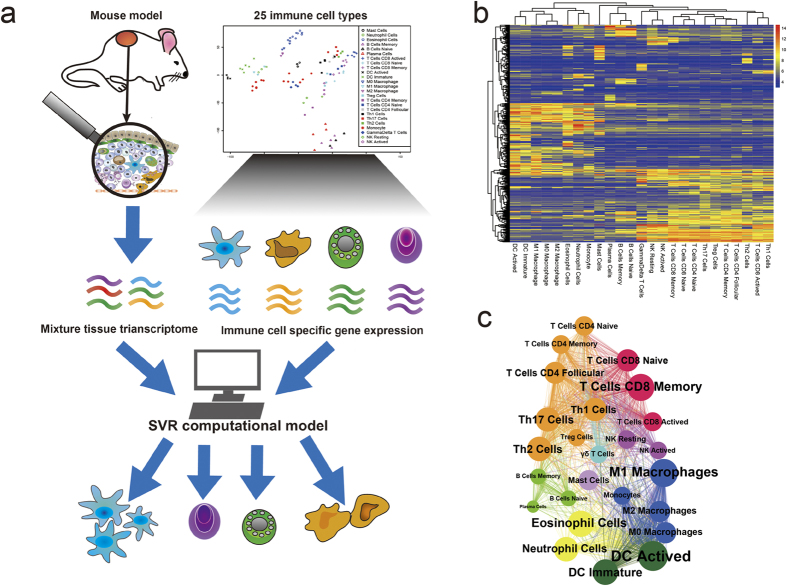
Figure 1. Schematics of estimating immune cell compositions from mouse tissue expression profile data.
(a) An overview of the computational model ImmuCC. (b) Heatmap of signature matrix for clustering all 511 signature genes among 25 immune cell types. (c) Relationship of 25 immune cell types by shared signature genes. The cell types are colored differently, the dot areas are proportional to the number of signature genes.

