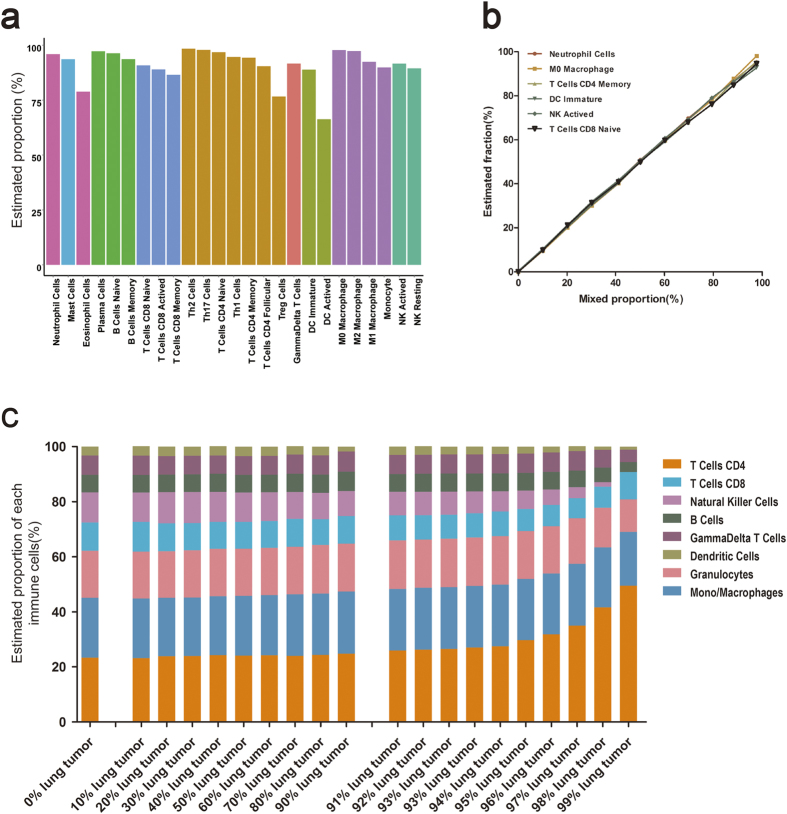
Figure 2. Model assessment in the simulated datasets.
(a) Performance in the 25 individual cell types. Nine major cell types were colored differently. (b) Performance in the mixture of one target cell type with other multiple immune cells randomly. The proportion of the testing immune cell ranges from 0 to 100 percent. (c) Performance in the mixture of immune cells with tumor contents. The leftmost bar represents the real and reference immune cell compositions. The tumor mixture ranges from 0 to 99 percent.

