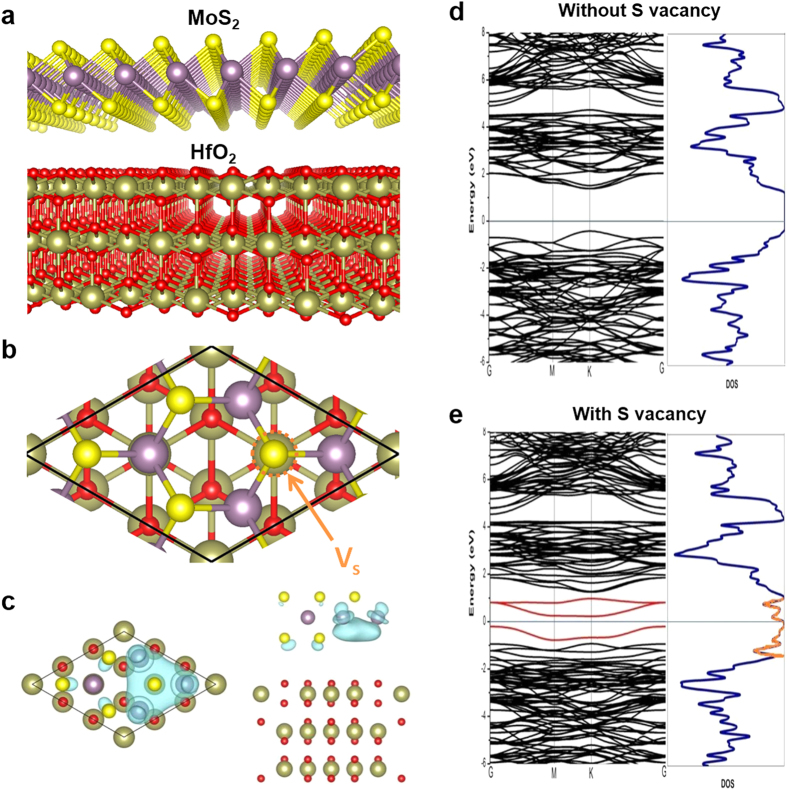
Figure 5. The top and side views of the MoS2-HfO2 interface structures.
(a) The perspective side view of the supercell of our model. (b) Top view of the unit cell. Vs indicates the location of S vacancy in the interfacial region for the calculation of the case with S vacancy. For MoS2-HfO2 interface with S vacancy, the marked S atom is removed. S atoms are represented by gold spheres; Mo atoms are represented by purple spheres; O atoms are represented by red spheres; Hf atoms are represented by green spheres. (c) Top and side views of real-space charge density of the defect state below the Fermi level at Γ (0, 0, 0). The charge density isosurfaces are taken to be 0.004 e/bohr3. (d) Band structure and its corresponding density of states (DOS) for the MoS2-HfO2 interface without S vacancy. Fermi levels are aligned at the origin of the energy scale. (e) Band structure and its corresponding DOS of MoS2-HfO2 interface with S vacancy. Fermi levels are aligned at the origin of the energy scale. The trap states are colored in red in the band structure and DOS, which exist within the MoS2 bandgap.

