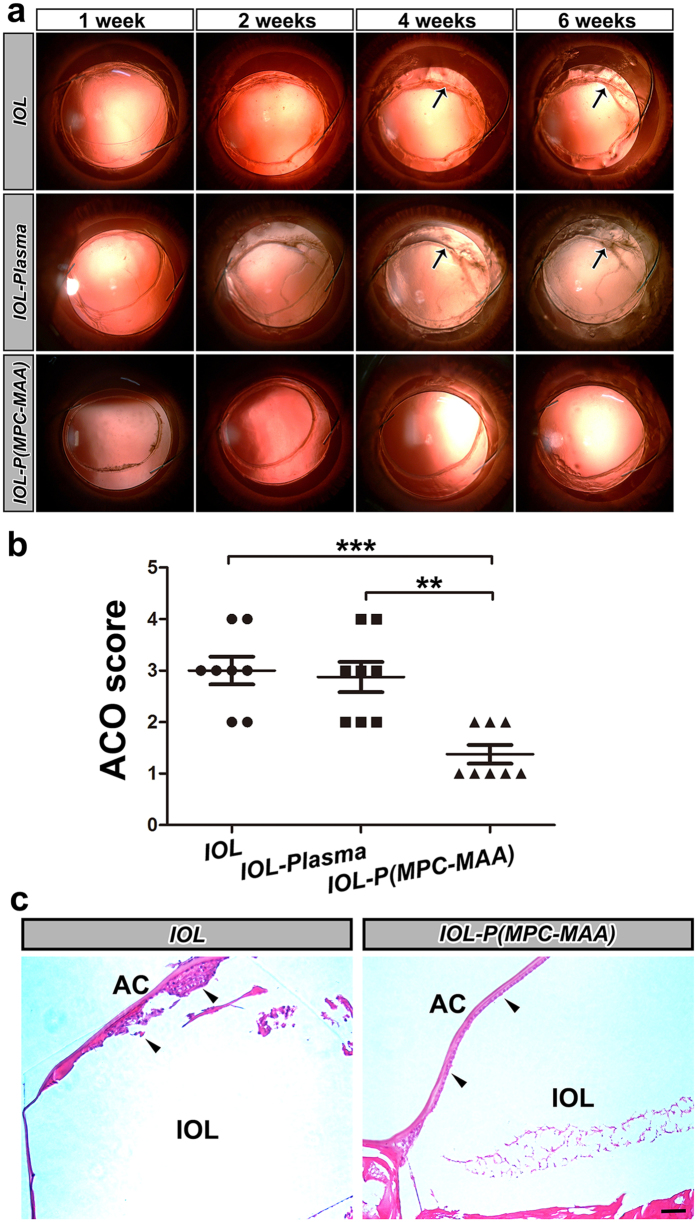
Figure 6. IOL-P(MPC-MAA) suppresses ACO formation after cataract surgery.
(a) Representative retroillumination slit lamp photos of anterior capsule opacification in each group 1 week, 2 weeks, 4 weeks, and 6 weeks after surgery, respectively. Black arrows indicate anterior capsule fibrosis and shrinkage. (b) Quantification of ACO scores in each group 6 weeks after surgery. n = 8. **P < 0.01, ***P < 0.001. (c) Representative HE staining images of anterior capsule in each group 8 weeks after surgery. Black arrowheads indicate LECs under anterior capsule. AC: anterior capsule. Scale bar = 50 μm.

