Figure 6.

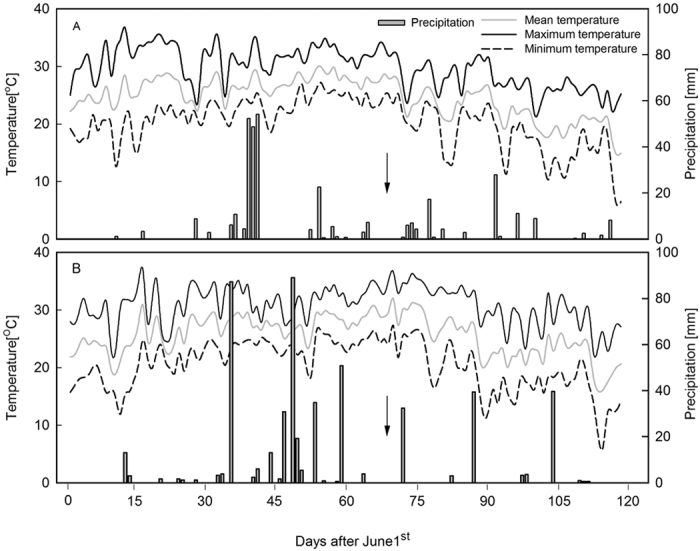
Maximum temperature, minimum temperature, mean temperature (°C) and precipitation (mm) recorded during the growing seasons (from June 1st to September 30th) in 2012 (A) and 2013 (B). The arrows indicated the timing of leaf removal imposed.

Maximum temperature, minimum temperature, mean temperature (°C) and precipitation (mm) recorded during the growing seasons (from June 1st to September 30th) in 2012 (A) and 2013 (B). The arrows indicated the timing of leaf removal imposed.