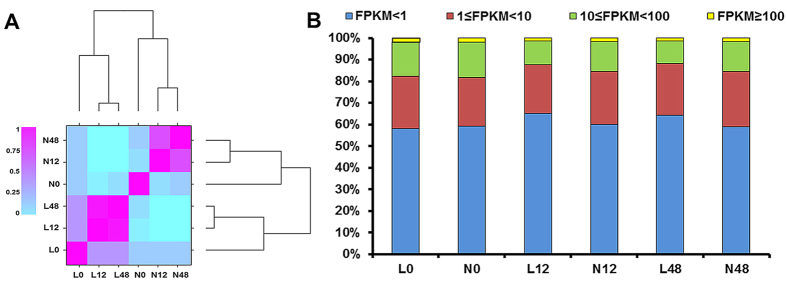
Figure 1. Gene expression analysis of the Lizixiang and ND98 root transcriptomes.
(A) Correlation of the global gene expression in Lizixiang and ND98 roots under 0-, 12-, and 48-h salt treatments. (B) Statistics of the gene expression levels (FPKM) in Lizixiang and ND98 samples. L0, Lizixiang 0 h; L12, Lizixiang 12 h; L48, Lizixiang 48 h; N0, ND98 0 h; N12, ND98 12 h; and N48, ND98 48 h.

